- Litecoin price failed to surpass the $65.00 resistance area and declined recently against the US Dollar.
- LTC price is currently trading well below the $62.50 and $62.00 support levels.
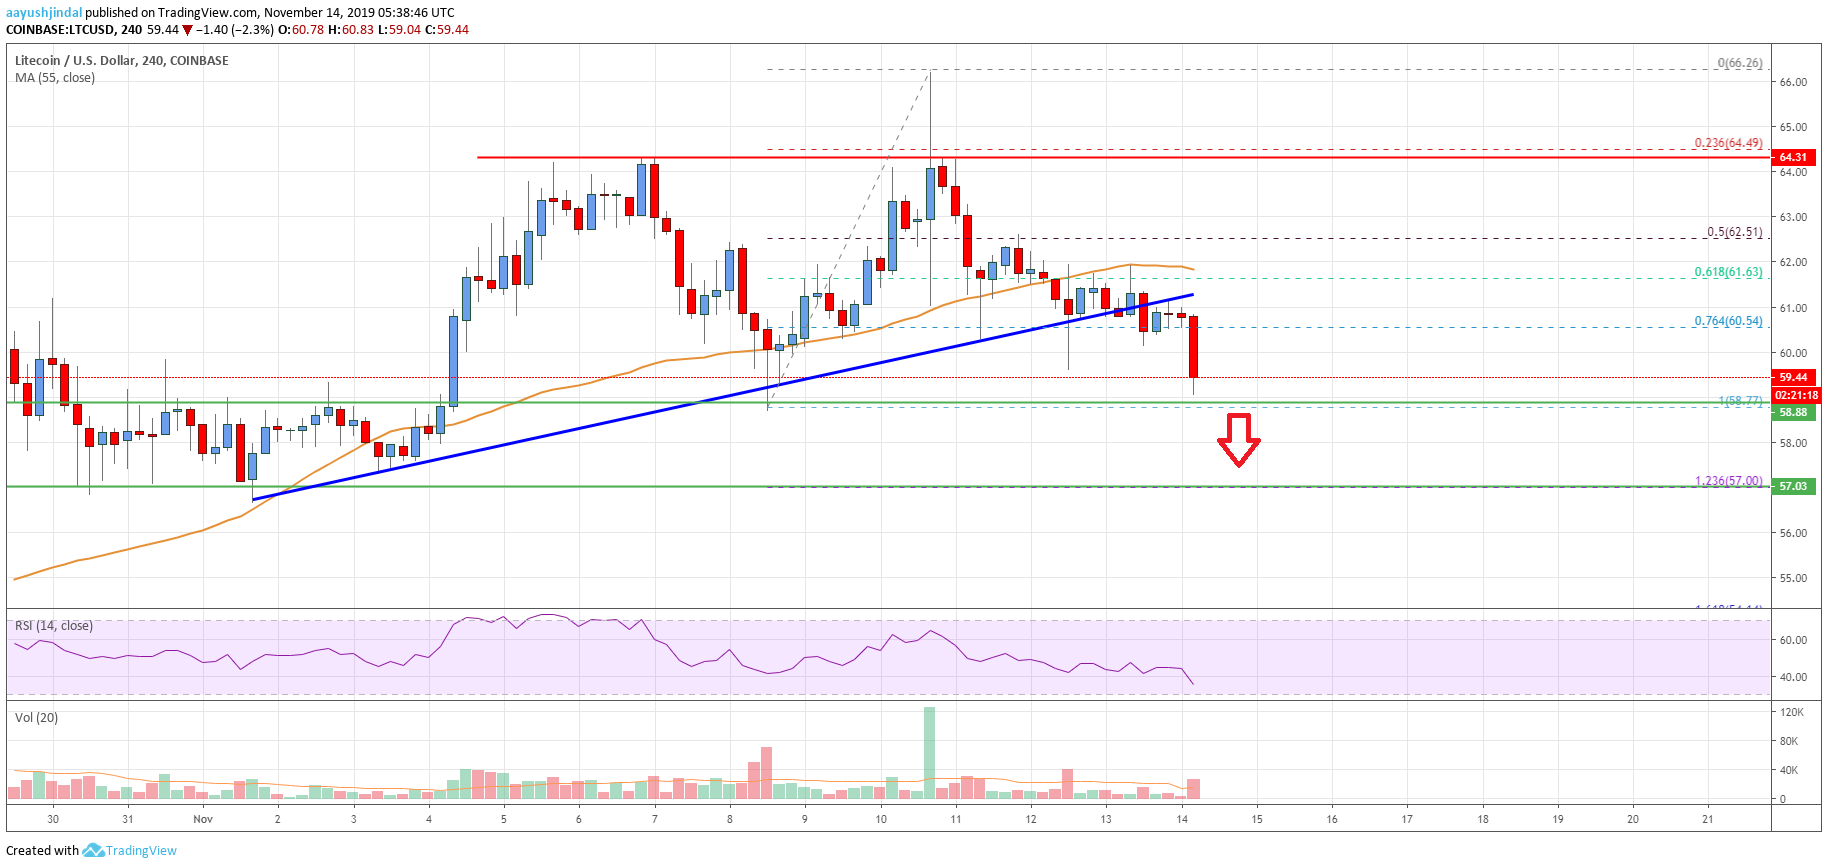
- There was a break below a major bullish trend line with support near $61.00 on the 4-hours chart of the LTC/USD pair (data feed from Coinbase).
- The pair remains at a risk of more losses below the $58.80 and $57.50 support levels.
Litecoin price is facing an increase in selling pressure against the US Dollar and bitcoin. LTC price is likely to struggle near $61.00 and it could slide below $58.00.
Litecoin Price Analysis
Recently, there was a downward move in bitcoin, Ethereum, ripple and litecoin against the US Dollar. LTC price failed to surpass the $65.00 resistance area and declined below the $62.00 support area.
The last swing high was formed near $66.26 before the price started a fresh decrease. It broke many supports near $62.50 and $62.00 to move into a bearish zone. Moreover, there was a break below the 61.8% Fib retracement level of the upward move from the $58.77 low to $66.26 high.
More importantly, there was a break below a major bullish trend line with support near $61.00 on the 4-hours chart of the LTC/USD pair. The pair is now trading below the $60.00 level and the 55 simple moving average (4-hours).
An immediate support is near the $58.80 support area. If the price fails to stay above the $58.80 support, it could continue to move down towards the next support at $57.00.
The 1.236 Fib extension level of the upward move from the $58.77 low to $66.26 high is also near the $57.00 level to provide support in the near term. Any further losses may perhaps push the price towards the $55.00 support area.
Conversely, if there is an upside correction, the price could test the $61.00 resistance. The main resistance is near the $62.00 area (the previous support). Additionally, the 55 simple moving average (4-hours) is also near the $62.00 area to act as a resistance.
Looking at the chart, litecoin price is clearly declining below key supports near $62.00 and $62.00. Therefore, there is a risk of more losses below the $58.80 support area. The main region where the bulls could take a stand is near the $57.00 level. On the upside, a close above $62.00 is must for a fresh increase to $65.00.
Technical indicators
4 hours MACD – The MACD for LTC/USD is gaining momentum in the bearish zone.
4 hours RSI (Relative Strength Index) – The RSI for LTC/USD is declining and it may test the 30 level.
Key Support Levels – $58.80 and $57.00.
Key Resistance Levels – $62.00 and $65.00.
