- Litecoin price is trading nicely above a major support at $45.50 against the US Dollar.
- LTC price is likely to start a strong upward move if it clears the $46.80 and $47.00 resistance levels.
- There is a key contracting triangle forming with resistance near $47.00 on the 4-hours chart of the LTC/USD pair (data feed from Coinbase).
- The pair could only start a bearish wave if it settles below the $45.00 support zone.
Litecoin price is showing signs of a bullish break above $47.00 against the US Dollar, similar to bitcoin. LTC price could rise sharply above $50.00 as long as it is above the $45.00 support.
Litecoin Price Analysis
In the past few days, there were mostly range moves in bitcoin, Ethereum, ripple, and litecoin against the US Dollar. Earlier, LTC price corrected lower below the $46.50 level and the 55 simple moving average (4-hours).
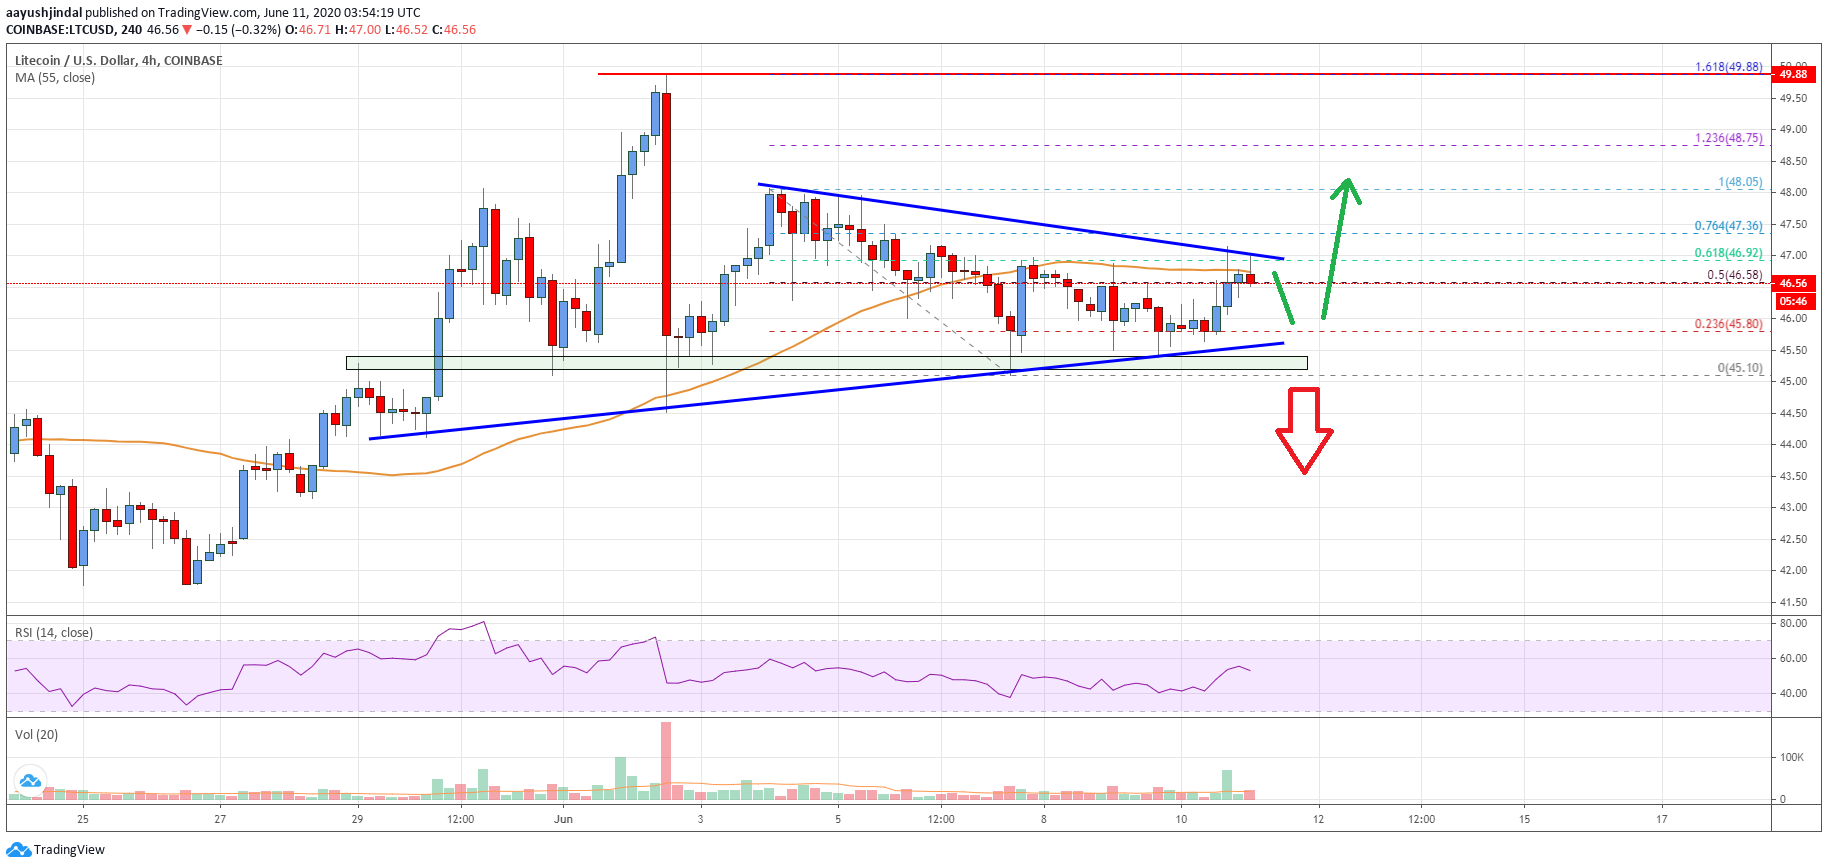
A low was formed near the $45.10 level before the price started trading in a range. It corrected above the $46.00 level and broke the 50% Fib retracement level of the recent decline from the $48.05 high to $45.10 low.
The price even spiked above the $46.50 level, but it seems to be facing hurdles near the $47.00 level and the 55 simple moving average (4-hours). Besides, there is a key contracting triangle forming with resistance near $47.00 on the 4-hours chart of the LTC/USD pair.
The triangle resistance is close to the 61.8% Fib retracement level of the recent decline from the $48.05 high to $45.10 low. If there is an upside break above the $47.00 resistance, there are chances of a strong rise in the coming sessions.
The next major resistance could be near the $50.00 level, above which the bulls are likely to aim a new monthly high above the $52.00 and $52.50 levels.
Conversely, the price might start a fresh decline below the $45.50 and $45.00 support levels. A successful daily close below the $45.00 support may perhaps start a major decline towards the $42.00 and $40.50 levels in the near term.
Looking at the chart, litecoin price is clearly preparing for the next crucial break and technical indicators suggest high chances of an upside break above the $47.00 and $48.00 resistance levels.
Technical indicators
4 hours MACD – The MACD for LTC/USD is slowly moving into the bullish zone.
4 hours RSI (Relative Strength Index) – The RSI for LTC/USD is currently above the 50 level.
Key Support Levels – $45.50 and $45.00.
Key Resistance Levels – $47.00 and $50.00.
