- Litecoin price surged more than 50% in the past two days and climbed above $80.00 against the US Dollar.
- LTC price tested the $100.00 resistance area and recently corrected lower below $90.00.
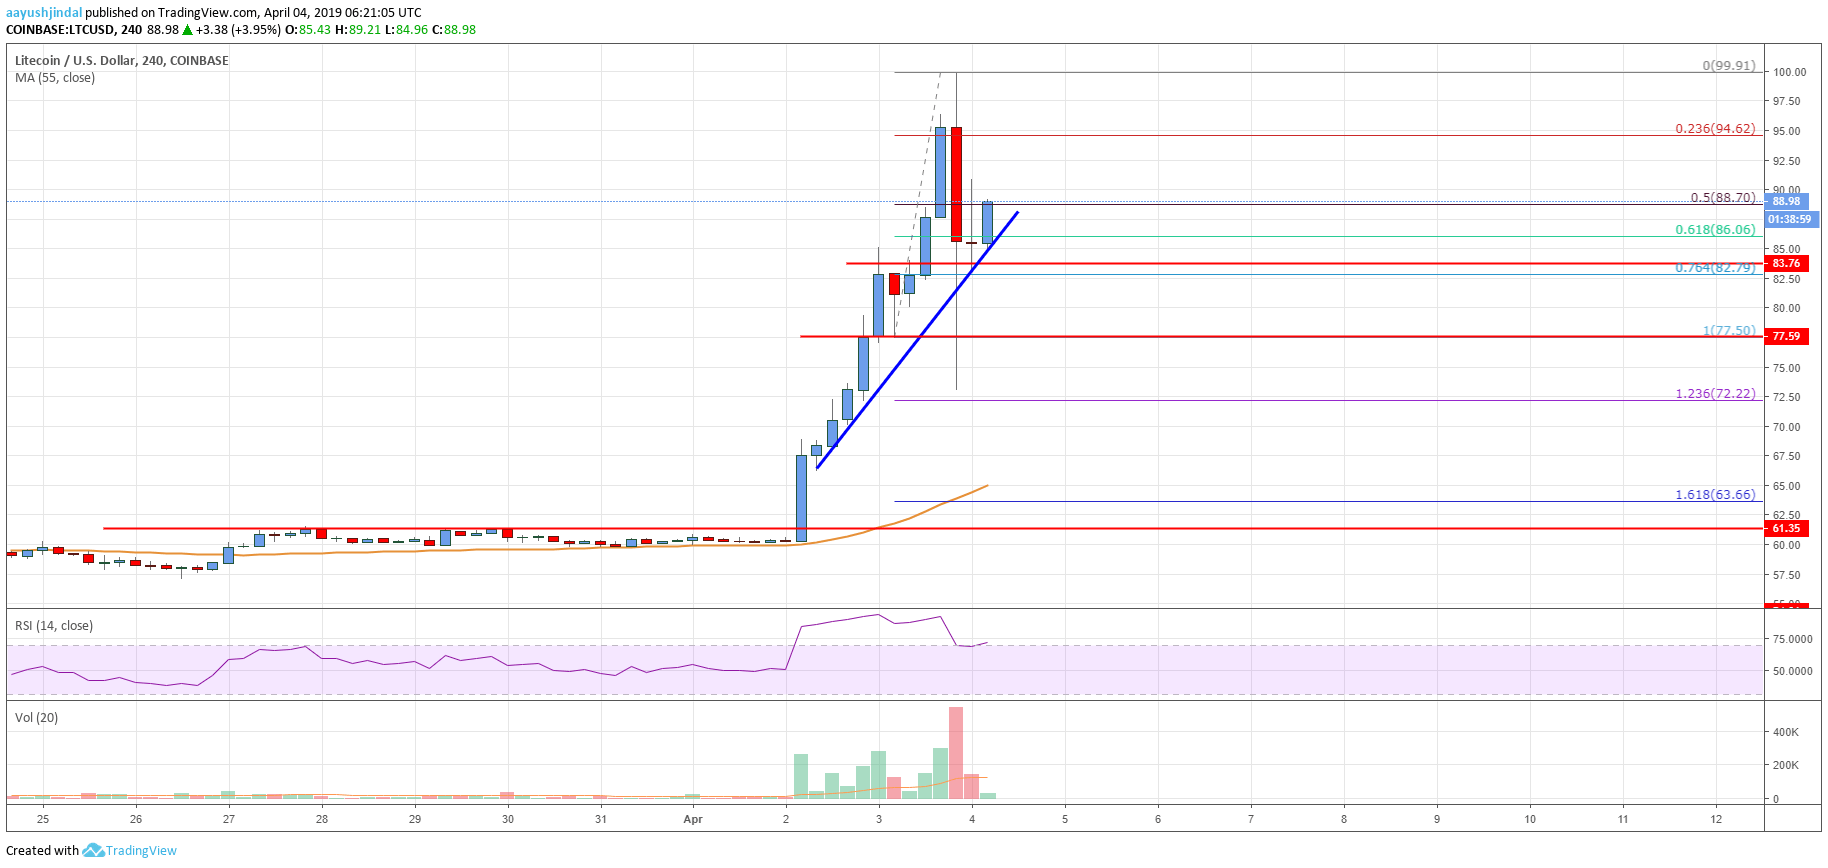
- There is a steep bullish trend line formed with support at $86.00 on the 4-hours chart of the LTC/USD pair (data feed from Coinbase).
- The pair is likely to climb higher towards $100.00 or $110.00 as long as the $77.50 support is intact.
Litecoin price climbed higher sharply with strong bullish moves against the US Dollar and bitcoin. LTC is likely to remain in an uptrend and it could even climb above the $100 barrier.
Litecoin Price Analysis
This week, there was a strong upside break above the $61.350 resistance in litecoin price against the US Dollar. The LTC/USD pair started a significant rally and gained more than 40% in the past two days. More importantly, there were solid bullish moves in bitcoin, Ethereum, ripple, EOS, ADA, TRX and other cryptocurrencies. It opened the doors for a sharp rally in LTC above the $70.00 and $80.00 resistance levels.
The price even climbed above the $85.00 resistance and settled well above the 55 simple moving average (4-hours). Finally, there was a break above the $92.00 resistance and the price traded close to the $100.00 barrier. A new 2019 high was formed at $99.91 and later the price corrected lower. There was a sharp dip below $85.00 and the 50% Fib retracement level of the recent ride from the $77.50 swing low to $99.91 high. There were multiple spiked below the $85.00 support.
However, the price later settled above the 76.4% Fib retracement level of the recent ride from the $77.50 swing low to $99.91 high. Besides, there is a steep bullish trend line formed with support at $86.00 on the 4-hours chart of the LTC/USD pair. Therefore, there are chances of a fresh increase above the $92.00 and $94.00 resistance levels.

Looking at the chart, litecoin price is placed nicely in a strong uptrend and it is likely to climb above $92.00. If buyers remain in action, the price may even revisit the $100.00 psychological level. The next major resistance is near the $110.00 level. On the downside, the trend line and $85.00 holds the key. If there is a break below $85.00, the price may revisit the $77.50 support area. Any further losses may push the price in a short term bearish zone towards $70.00.
Technical indicators
4 hours MACD – The MACD for LTC/USD is placed heavily in the bullish zone, with a positive bias.
4 hours RSI (Relative Strength Index) – The RSI for LTC/USD corrected lower and tested the 70 level.
Key Support Levels – $85.00 and $77.50.
Key Resistance Levels – $94.0 and $100.00.


Leave a Reply
You must be logged in to post a comment.