- Litecoin price rallied recently and broke the $50.00 resistance area against the US Dollar.
- LTC price tested the key $54.00 resistance and it is currently consolidating gains.
- There was a break above a major connecting resistance trend line at $51.00 on the 4-hours chart of the LTC/USD pair (data feed from Coinbase).
- The pair could correct lower in the short term, but it is likely to extend gains above $54.00 and $55.00.
Litecoin price started a strong rally recently against the US Dollar and bitcoin. LTC gained around 15%, broke the $52.00 resistance, and now it could trade above the $55.00 resistance.
Litecoin Price Analysis
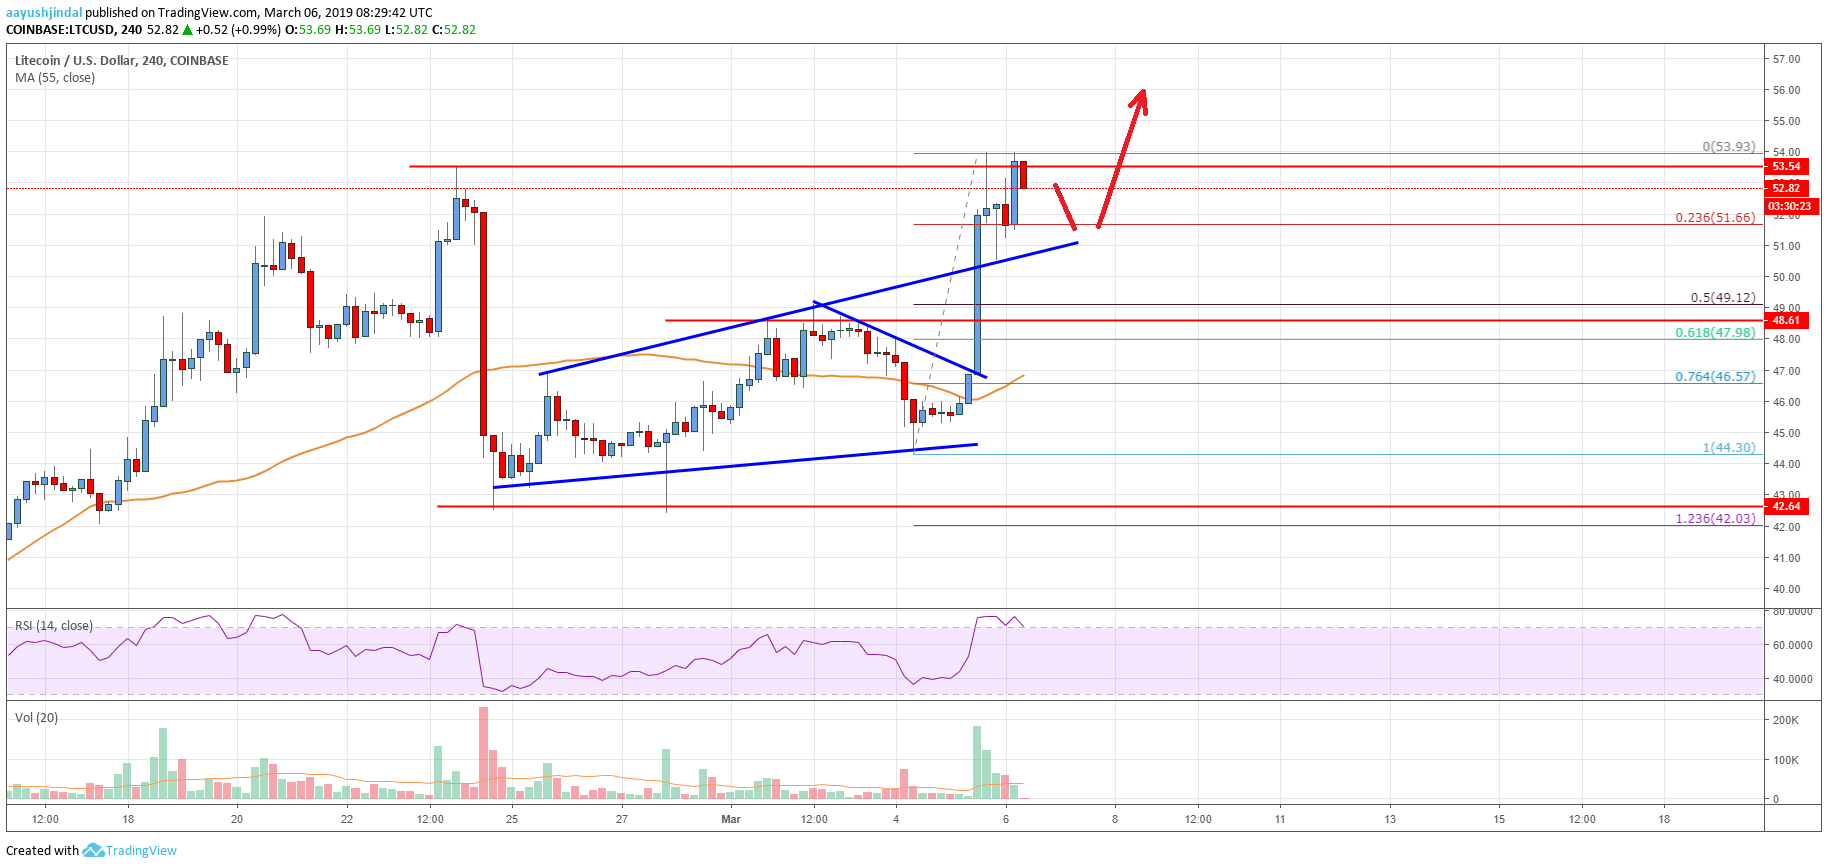
This past week, there were bearish moves in litecoin price below $50.00 against the US Dollar. The LTC/USD pair traded below the $46.00 support, but the $44.00 level acted as a strong support. Recently, all major cryptocurrencies such as bitcoin, ripple, Ethereum, and bitcoin cash gained traction, resulting in a positive reaction in LTC. The price started a strong upward move after trading as low as $44.30. To start with, it broke a bearish trend line with resistance at $47.20 on the 4-hours chart.
It opened the doors for more gains and the price broke the $50.00 resistance and the 55 simple moving average (4-hours). Finally, there was a break above a major connecting resistance trend line at $51.00 on the same chart. However, the recent rally faced a strong resistance near the last swing high at $54.00. The LTC/USD pair is currently consolidating gains above the $52.00 support. On the downside, an initial support is near $51.00 and the broken trend line. The 23.6% Fib retracement level of the last wave from the $44.30 low to $53.93 high is also near the $51.66 level to act as a support.
Therefore, if the price corrects lower, it could find support near $51.50 or $51.00. Below these levels, the price could test the $49.00 support area. It coincides with the 50% Fib retracement level of the last wave from the $44.30 low to $53.93 high.

Looking at the chart, litecoin price is clearing zooming higher and it is likely to break the $54.00 and $55.00 resistances. The next major resistance could be $58.00 and $60.00, where sellers may emerge. Conversely, dips towards the $51.50 and $50.00 levels are likely to find a strong buying interest in the near term.
Technical indicators
4 hours MACD – The MACD for LTC/USD moved strongly into the bullish zone, with a positive bias.
4 hours RSI (Relative Strength Index) – The RSI for LTC/USD moved higher sharply into the overbought zone above the 70 level.
Key Support Levels – $51.00 and $50.00.
Key Resistance Levels – $54.00 and $55.00.


Leave a Reply
You must be logged in to post a comment.