- Ripple price is holding the key $0.2560 support zone against the US dollar.
- The price is still facing many hurdles near $0.3000 and the 55 simple moving average (4-hours).
- There is a major bearish trend line forming with resistance near $0.2820 on the 4-hours chart of the XRP/USD pair (data source from Bittrex).
- The pair could accelerate higher once it clears the $0.2820 and $0.2840 resistance levels.
Ripple price is trading in a positive zone above $0.2560 against the US Dollar. XRP price must settle above $0.2840 to increase the chances of a break above $0.3000.
Ripple Price Analysis
This past week, ripple price topped near the $0.3288 level against the US Dollar. The XRP/USD pair declined steadily and traded below the $0.3000 support level.
There was also a spike below the main $0.2560 support level and the price settled below 55 simple moving average (4-hours). It traded as low as $0.2408 and recovered quickly above $0.2560. There was a clear break above the 23.6% Fib retracement level of the downward move from the $0.3288 high to $0.2408 low.
However, the price is still facing many hurdles near $0.3000 and the 55 simple moving average (4-hours). There is also a major bearish trend line forming with resistance near $0.2820 on the 4-hours chart of the XRP/USD pair.
The trend line is close to the 50% Fib retracement level of the downward move from the $0.3288 high to $0.2408 low. A clear break above the trend line resistance could easily push the price towards the $0.3000 resistance level.
The next key resistance is near the $0.3080 level, above which the price is likely to jump towards the $0.3400 and $0.3500 levels. Conversely, the price could fail to clear $0.2840 and the $0.3000 barrier. An initial support on the downside is near the $0.2620 level.
The main support is still near the $0.2560 level. A daily close below the $0.2560 level could spark a sharp decline towards the $0.2200 and $0.2100 levels.
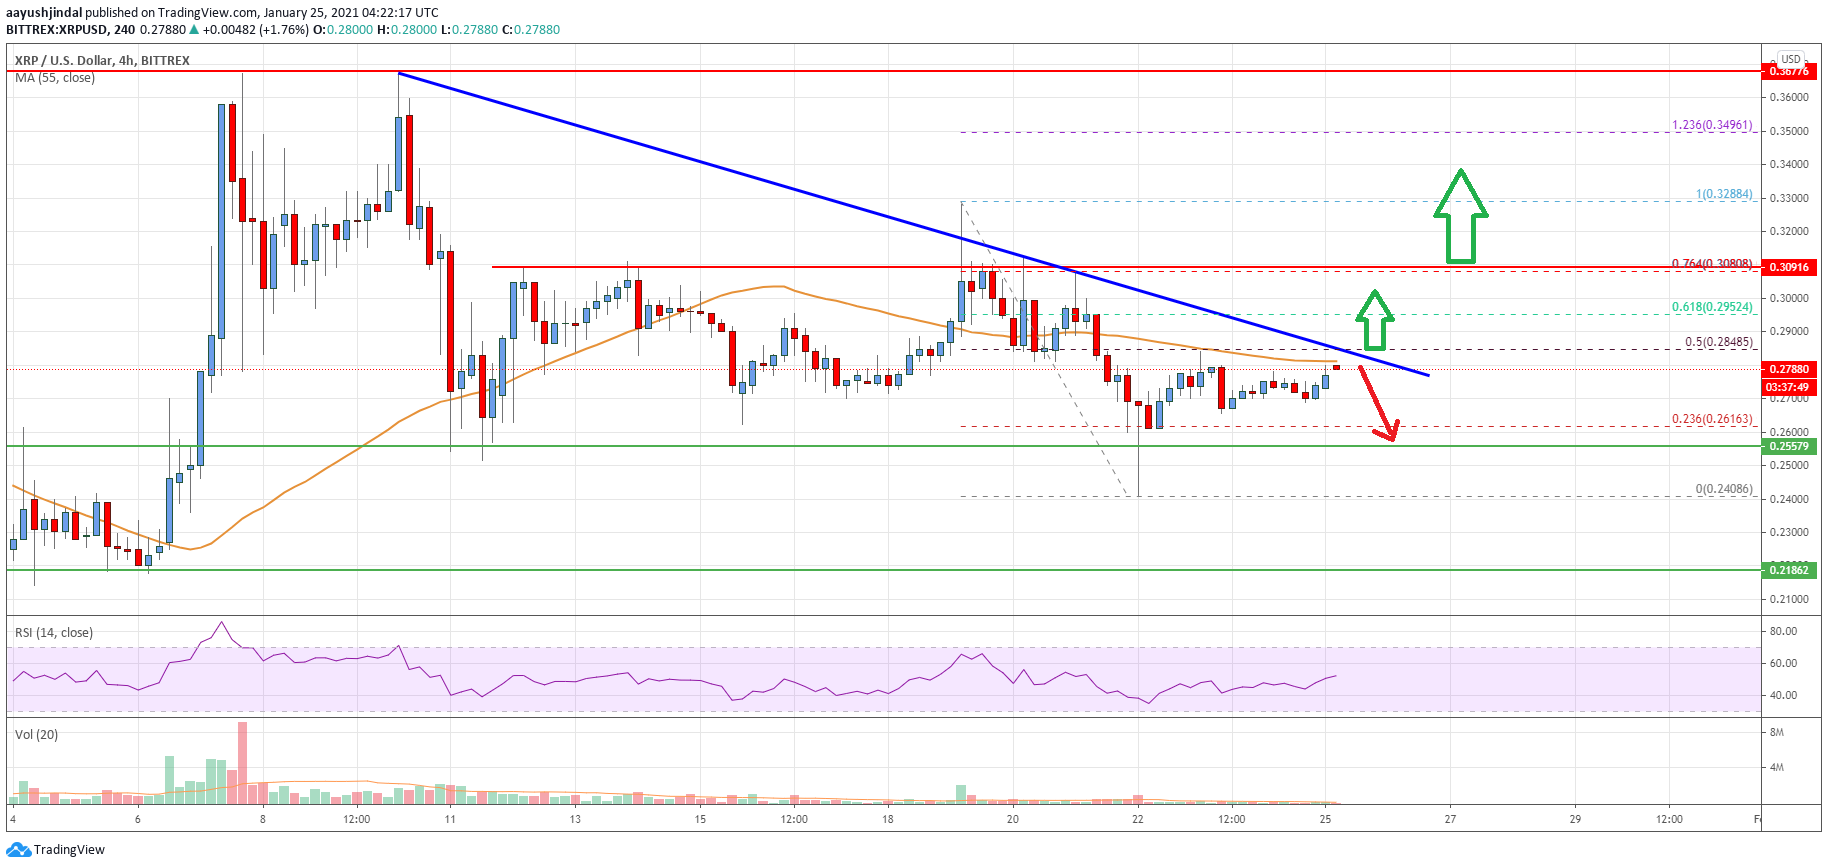
Looking at the chart, ripple price is clearly trading below major hurdles near $0.2840 the 55 simple moving average (4-hours). Overall, the price could accelerate higher once it clears the $0.2820 and $0.2840 resistance levels.
Technical indicators
4 hours MACD – The MACD for XRP/USD is currently gaining momentum in the bullish zone.
4 hours RSI (Relative Strength Index) – The RSI for XRP/USD is now just above the 50 level.
Key Support Levels – $0.2620, $0.2560 and $0.2550.
Key Resistance Levels – $0.2840 and $0.3000.
