- Ripple price is struggling to climb above the $0.95 and $1.05 resistance levels against the US dollar.
- The price is now trading well below $1.00 and the 55 simple moving average (4-hours).
- There is a key declining channel forming with resistance near the $0.9240 on the 4-hours chart of the XRP/USD pair (data source from Bittrex).
- The pair could extend its decline as long as it is below the $1.05 resistance zone.
Ripple price is trading in a bearish zone below $1.00 against the US Dollar. XRP price remains at a risk of more losses below the $0.80 support in the near term.
Ripple Price Analysis
Recently, ripple price started a decent recovery from the $0.6500 zone against the US Dollar. The XRP/USD pair climbed above the $0.800 and $0.900 resistance levels.
There was also a break above the $1.00 barrier. However, the price failed to clear the $1.10 resistance zone and the 55 simple moving average (4-hours). A high was formed near $1.07 and the price recently started a fresh decline.
There was a break below the $0.90 support zone. The bears pushed the price below the 50% Fib retracement level of the upward move from the $0.6513 swing low to $1.077 swing high.
It is now trading well below $1.00 and the 55 simple moving average (4-hours). There is also a key declining channel forming with resistance near the $0.9240 on the 4-hours chart of the XRP/USD pair. An immediate support is near the $0.815 level.
The 61.8% Fib retracement level of the upward move from the $0.6513 swing low to $1.077 swing high is also near the $0.814 level. Any more losses could lead the price towards the $0.75 support. The next major support is near the $0.6500 zone.
If there is an upside break above the channel resistance, the price could rise towards the $1.00 resistance. The next major resistance is near the $1.05 level. A clear break above $1.05 could set the pace for a larger increase.
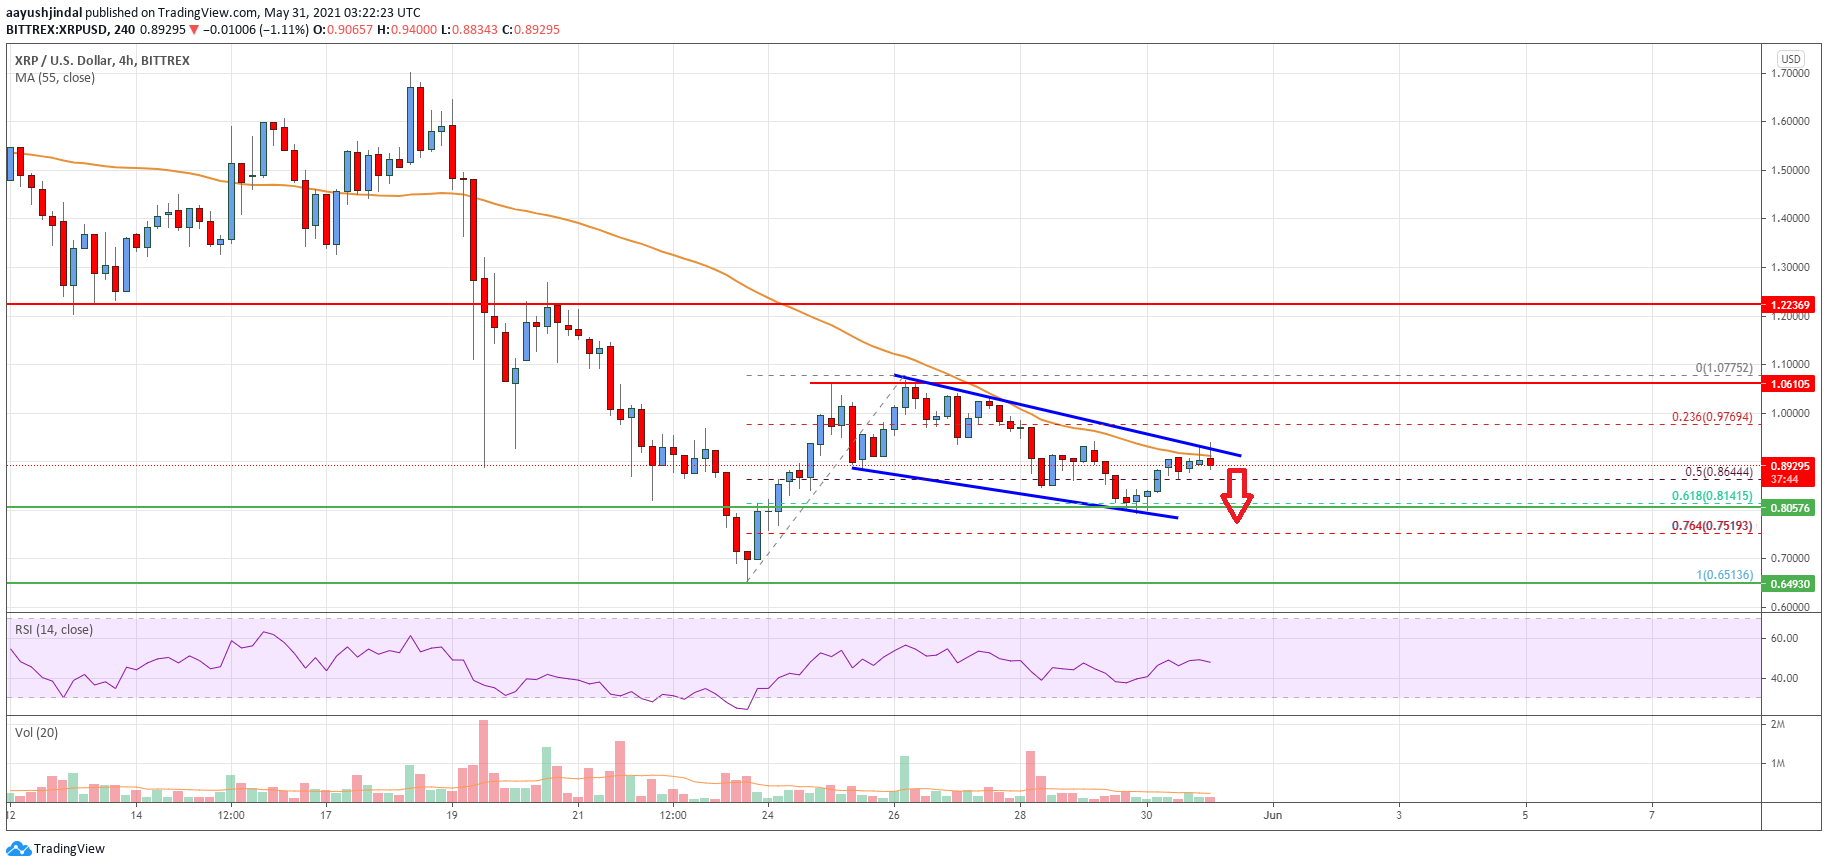
Looking at the chart, ripple price is clearly trading well below $1.00 and the 55 simple moving average (4-hours). Overall, the price could extend its decline as long as it is below the $1.05 resistance zone.
Technical indicators
4 hours MACD – The MACD for XRP/USD is now gaining momentum in the bearish zone.
4 hours RSI (Relative Strength Index) – The RSI for XRP/USD is just below the 50 level.
Key Support Levels – $0.84, $0.75 and $0.650.
Key Resistance Levels – $0.95 and $1.05.
