Key Highlights
- Ripple price is currently consolidating above the $0.2903 low against the US dollar.
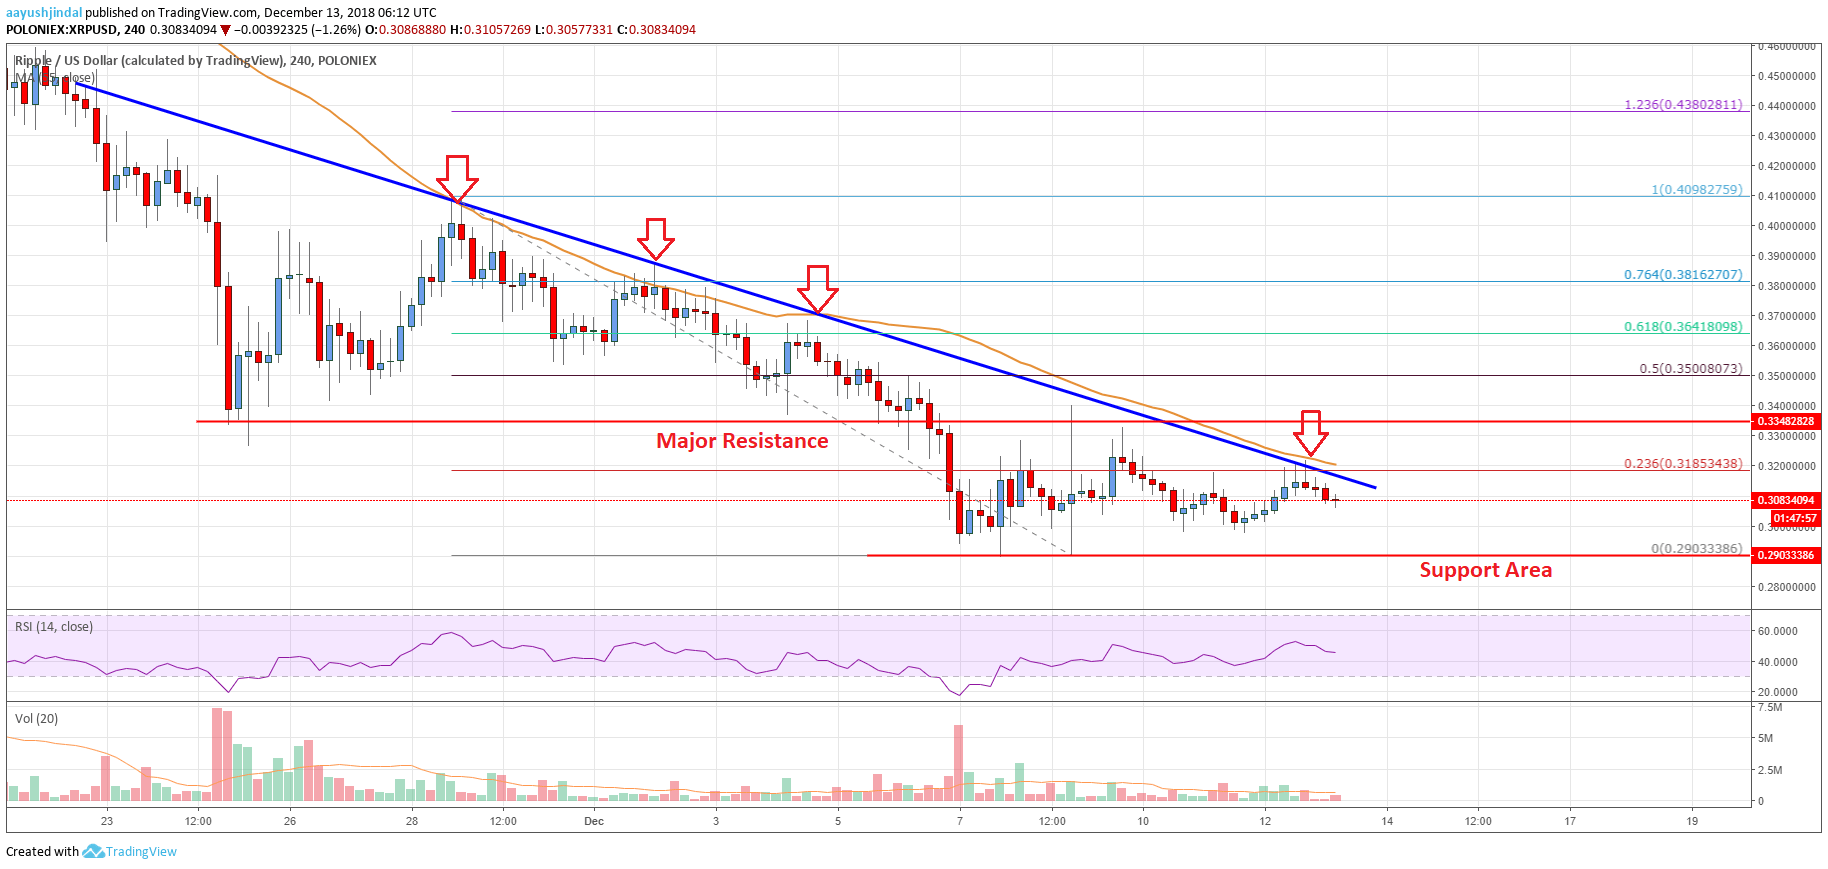
- There is a significant bearish trend line in place with resistance at $0.3145 on the 4-hours chart of the XRP/USD pair (data source from Poloniex).
- The pair may soon make the next move either above $0.3150 or below $0.2903.
Ripple price is preparing for the next key break against the US Dollar. XRP may perhaps decline further below $0.2903 and $0.2800 if there is no break above $0.3145.
Ripple Price Analysis
After a sharp decline, ripple price traded towards the $0.2900 level against the US Dollar. The XRP/USD pair formed a low at $0.2903 and settled below the 55 simple moving average (4-hours). Later, the price started consolidating losses above the $0.2900-0.2910 support area. It recently recovered above the $0.3200 level. Besides, there was a break above the 23.6% Fib retracement level of the last drop from the $0.4098 high to $0.2903 low.
However, the upside move was capped by the $0.3350 level. The stated $0.3350 level was a support earlier and now it prevented a bullish break. More importantly, there is a significant bearish trend line in place with resistance at $0.3145 on the 4-hours chart of the XRP/USD pair. The trend line coincides with the 55 simple moving average (4-hours), which is at $0.3180. Therefore, a proper break above the $0.3145 and $0.3180 levels is must for an upside break. The next resistance is at $.3350, followed by the 50% Fib retracement level of the last drop from the $0.4098 high to $0.2903 low.

Looking at the chart, ripple price seems to be preparing for the next move either above $0.3145 or below $0.2903. If there is a bearish break, the price could drop to $0.2650 or even $0.2500.
Looking at the technical indicators:
4-hours MACD – The MACD for XRP/USD is in the bearish zone.
4-hours RSI (Relative Strength Index) – The RSI for XRP/USD declined below the 50 level.
Key Support Level – $0.2903
Key Resistance Level – $0.3145


Leave a Reply
You must be logged in to post a comment.