- Ripple price failed to gain pace above the $0.3300 level and recently declined against the US dollar.
- The price seems to be facing a lot of resistance near the $0.3280 and $0.3300 resistance levels.
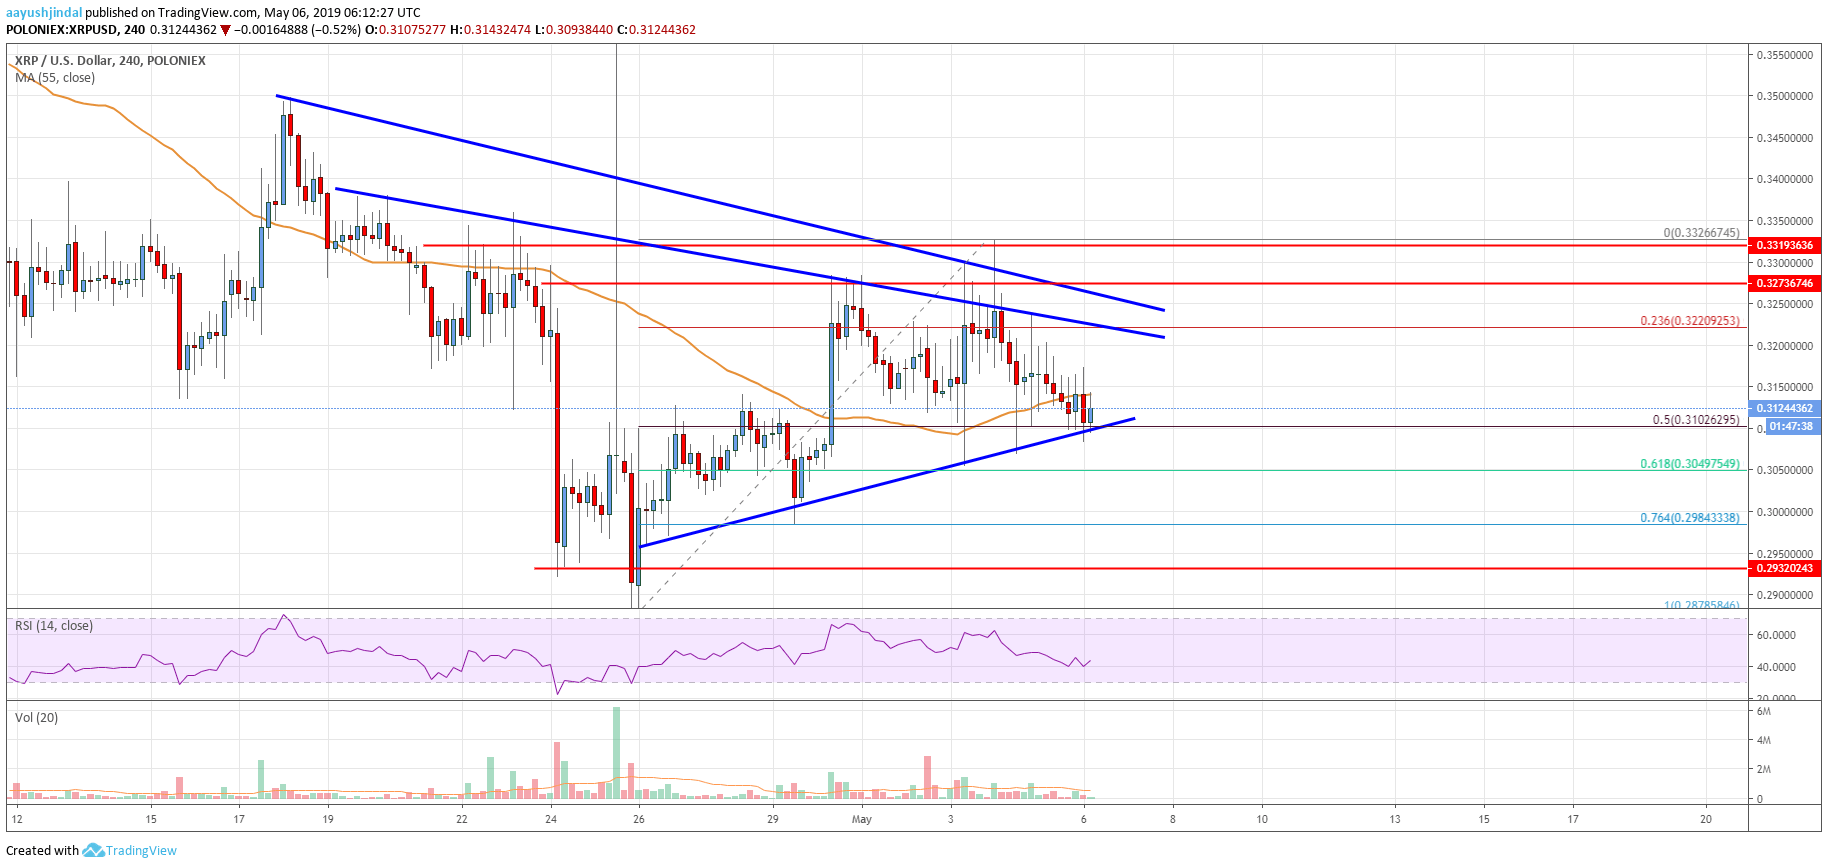
- There are two new key bearish trend lines formed with resistance near $0.3240 on the 4-hours chart of the XRP/USD pair (data source from Poloniex).
- The price must clear the $0.3240 and $0.3300 resistance levels to move into a positive zone.
Ripple price remains in a downtrend below $0.3300 against the US Dollar. XRP could decline sharply if it continues to struggle near $0.3240 and $0.3300 in the near term.
Ripple Price Analysis
This past week, there was a decent upward move in bitcoin, Ethereum, bitcoin cash, ADA and ripple against the US Dollar. The XRP/USD pair started to climb above the $0.3100 and $0.3220 resistance levels. The price even broke the $0.3250 resistance and the 55 simple moving average (4-hours). Finally, there was a break above the $0.3300 level before the price topped near the $0.3326 level. It seems like the price was rejected above $0.3300, resulting in a drop below $0.3250.
The price broke the $0.3240 support, and the 23.6% Fib retracement level of the last wave from the $0.2878 low to $0.3326 high. However, a crucial bullish trend line with current support at $0.3100 is acting as a strong barrier for sellers. Besides, the 50% Fib retracement level of the last wave from the $0.2878 low to $0.3326 high is also acting as a support. If there is a close below $0.3100 and the 55 simple moving average (4-hours), the price is likely to decline towards $0.3000.
The next key support is near $0.2984, and the 76.4% Fib retracement level of the last wave from the $0.2878 low to $0.3326 high. On the upside, there are many hurdles near the $0.3220, $0.3240 and $0.3300 levels. There are also two new key bearish trend lines formed with resistance near $0.3240 on the same chart. A successful close above these trend lines and a follow through above $0.3300 is needed for a fresh increase.

Looking at the chart, ripple price is clearly trading below key hurdles near $0.3220, $0.3240 and $0.3300. As long as the price is below $0.3240, there is a risk of a bearish break. A successful close below $0.3100 is likely to spark a lot of bearish moves below $0.3060 and $0.3020 in the near term.
Technical indicators
4 hours MACD – The MACD for XRP/USD is gaining pace in the bearish zone.
4 hours RSI (Relative Strength Index) – The RSI for XRP/USD is now well below the 50 level.
Key Support Levels – $0.3100, $0.3060 and $0.3000.
Key Resistance Levels – $0.3240 and $0.3300.


Leave a Reply
You must be logged in to post a comment.