- Ripple price started a significant decline from well above the $0.3480 level against the US dollar.
- The price declined heavily below $0.3000 and traded close to the $0.2780 support area.
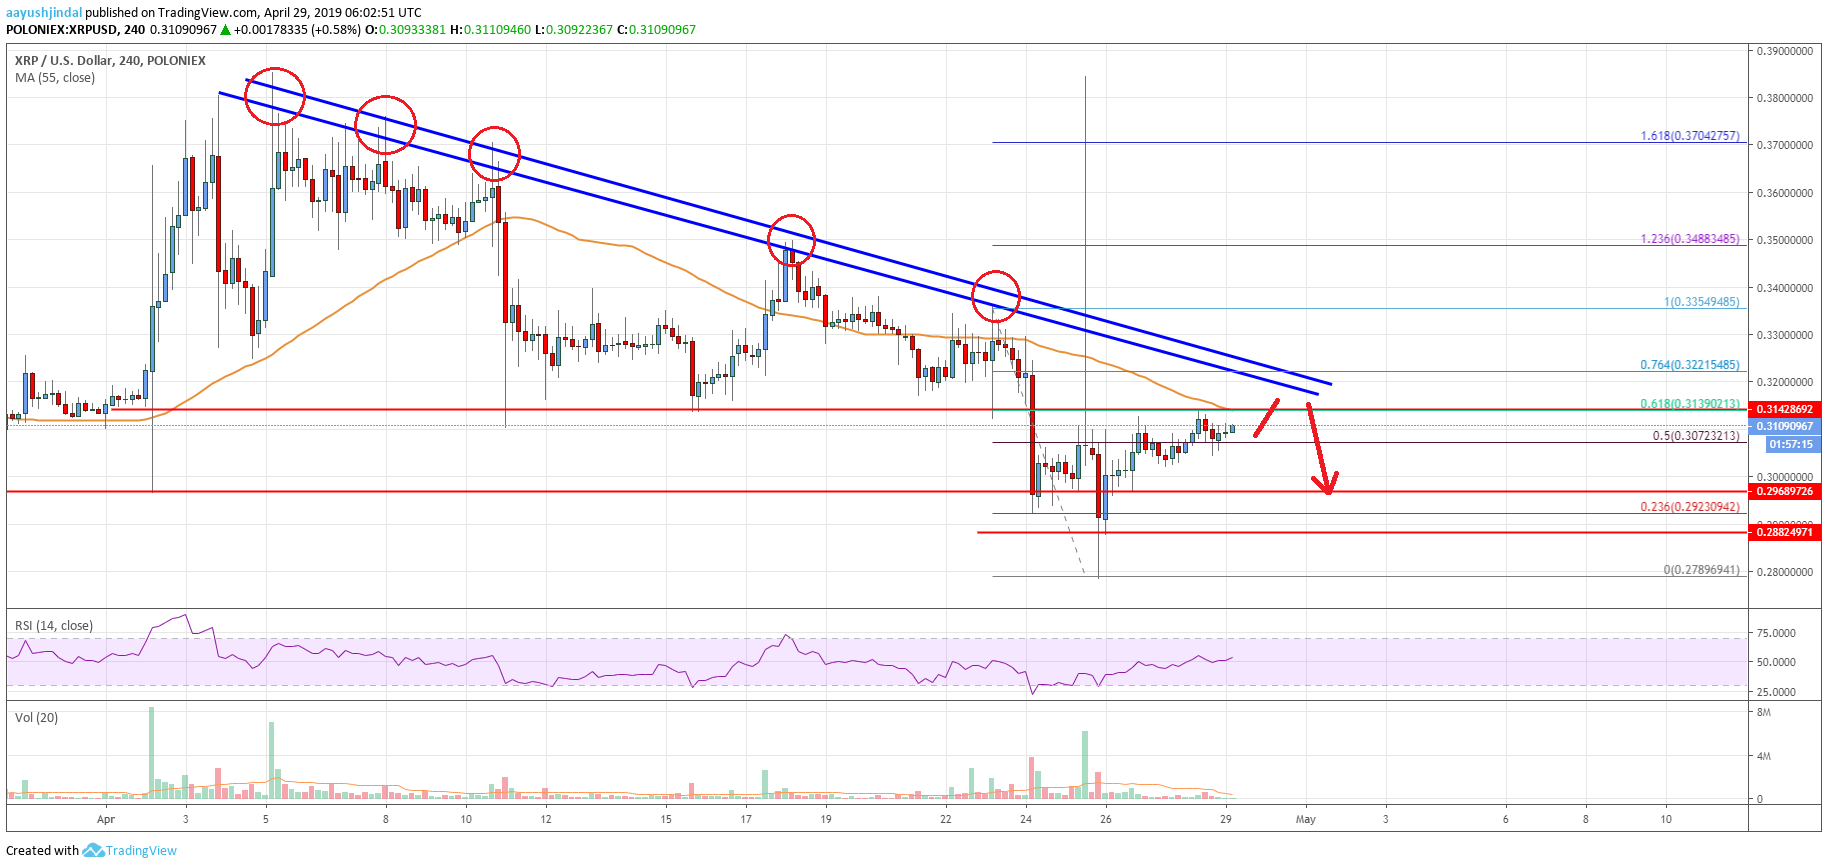
- There are two crucial bearish trend lines in place with resistance near $0.3210 on the 4-hours chart of the XRP/USD pair (data source from Poloniex).
- The price remains at a risk of more losses if it fails to clear the $0.3210 and $0.3240 resistance levels.
Ripple price declined heavily below important supports against the US Dollar. XRP is currently recovering, but approaching a couple of crucial resistances near the $0.3210 level.
Ripple Price Analysis
This past week, there was a sharp decline in bitcoin, Ethereum, bitcoin cash, ADA and ripple against the US Dollar. The XRP/USD pair fell below the key $0.3120 and $0.3000 support levels to trade to a new monthly low. The decline was such that the price even broke $0.2840 and traded towards the $0.2780 level. A swing low was formed at $0.2789 and the price settled below the 55 simple moving average (4-hours).
Recently, the price started an upside correction above the $0.2925 level. It cleared the 23.6% Fib retracement level of the last downward move from the $0.3354 high to $0.2789 low. The recent recovery was positive since the price even traded above the $0.3050 level. It gained traction above the 50% Fib retracement level of the last downward move from the $0.3354 high to $0.2789 low. However, the price is facing a lot of hurdles near the $0.3140, $0.3200 and $0.3210 levels.
The first hurdle is $0.3140 and the 61.8% Fib retracement level of the last downward move from the $0.3354 high to $0.2789 low. However, the main resistance is near the $0.3200-0.3210 area. There are also two crucial bearish trend lines in place with resistance near $0.3210 on the 4-hours chart of the XRP/USD pair. Therefore, a successful close above the $0.3210 level and the 55 SMA may start a decent upward move. The next key resistance is near the $0.3320 and $0.3350 levels.

Looking at the chart, ripple price is clearly trading near significant barriers near $0.3200. If the bulls fail to clear $0.3200 or $0.3210, there could be a fresh drop in the near term. An initial support is near the $0.3050 level, below which the price could test $0.3000. A close back below $0.3000 might set the pace for a push towards $0.2840.
Technical indicators
4 hours MACD – The MACD for XRP/USD is slowly moving into the bullish zone.
4 hours RSI (Relative Strength Index) – The RSI for XRP/USD is slowly moving higher towards the 55 and 60 levels.
Key Support Levels – $0.3050, $0.3000 and $0.2840.
Key Resistance Levels – $0.3140 and $0.3210.


Leave a Reply
You must be logged in to post a comment.