- Ripple price is currently correcting losses after trading as low as $0.2902 against the US dollar.
- The price is facing a strong resistance near the $0.3050 and $0.3060 levels.
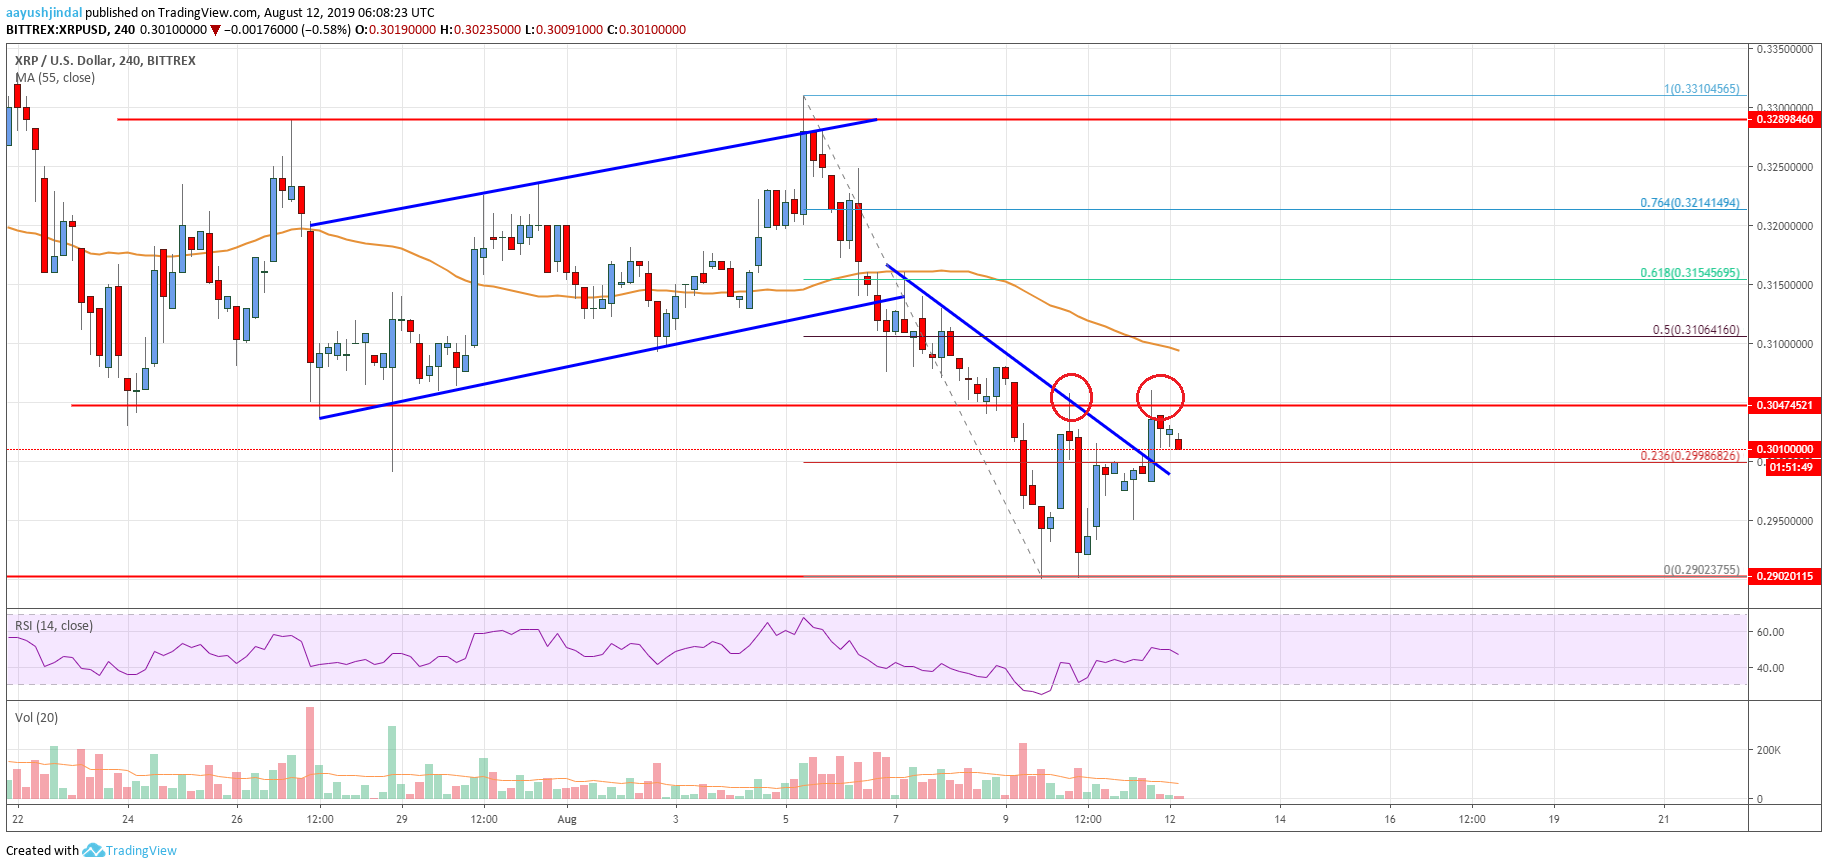
- Recently, there was a break above a key bearish trend line with resistance at $0.2995 on the 4-hours chart of the XRP/USD pair (data source from Bittrex).
- The price must surpass the $0.3050 resistance level to continue higher in the near term.
Ripple price is slowly recovering above $0.3000 against the US Dollar. However, XRP price might struggle to gain momentum above the $0.3050 and $0.3100 resistances.
Ripple Price Analysis
This past week, there was a fresh decline in bitcoin, Ethereum, bitcoin cash, ADA and ripple against the US Dollar. The XRP/USD pair broke many important supports near the $0.3150 level. Moreover, there was a break below a major ascending channel with support near $0.3130 on the 4-hours chart. Finally, the price traded below the $0.3050 support level and settled below the 55 simple moving average (4-hours).
The price traded to a new monthly low at $0.2902 and it recently started an upside correction. There was a break above the $0.2980 resistance area. The price even climbed above the 23.6% Fib retracement level of the last key drop from the $0.3310 high to $0.2901 low. Moreover, there was a break above a key bearish trend line with resistance at $0.2995 on the 4-hours chart of the XRP/USD pair.
However, the price failed near the $0.3050 and $0.3060 resistance levels (the previous support area). There were two attempts to surpass the $0.3060 level, but the bulls failed to gain momentum. On the upside, the next major resistance is near the $0.3100 area and the 55 simple moving average (4-hours). The 50% Fib retracement level of the last key drop from the $0.3310 high to $0.2901 low is also near the $0.3105 level.
Therefore, the price might face a strong barrier near the $0.3100 level if it climbs above $0.3060. A successful close above the $0.3100 resistance and the 55 SMA might start a solid rise. The next key resistance is near the $0.3200 area. Conversely, if the price fails to climb above $0.3060, it could resume its slide.

Looking at the chart, ripple price seems to be facing many important hurdles near $0.3060 and $0.3100. A successful close above $0.3100 is needed for a decent recovery. If not, the price might decline towards $0.2800.
Technical indicators
4 hours MACD – The MACD for XRP/USD is losing momentum in the bullish zone.
4 hours RSI (Relative Strength Index) – The RSI for XRP/USD is moving lower after it failed near the 50 level.
Key Support Levels – $0.3000, $0.2900 and $0.2800.
Key Resistance Levels – $0.3060 and $0.3100.


Leave a Reply
You must be logged in to post a comment.