- Ripple price is down more than 20% in the past few days and settled below $0.2500 against the US dollar.
- The price is currently trading in a bearish zone and it recently tested the $0.2000 area.
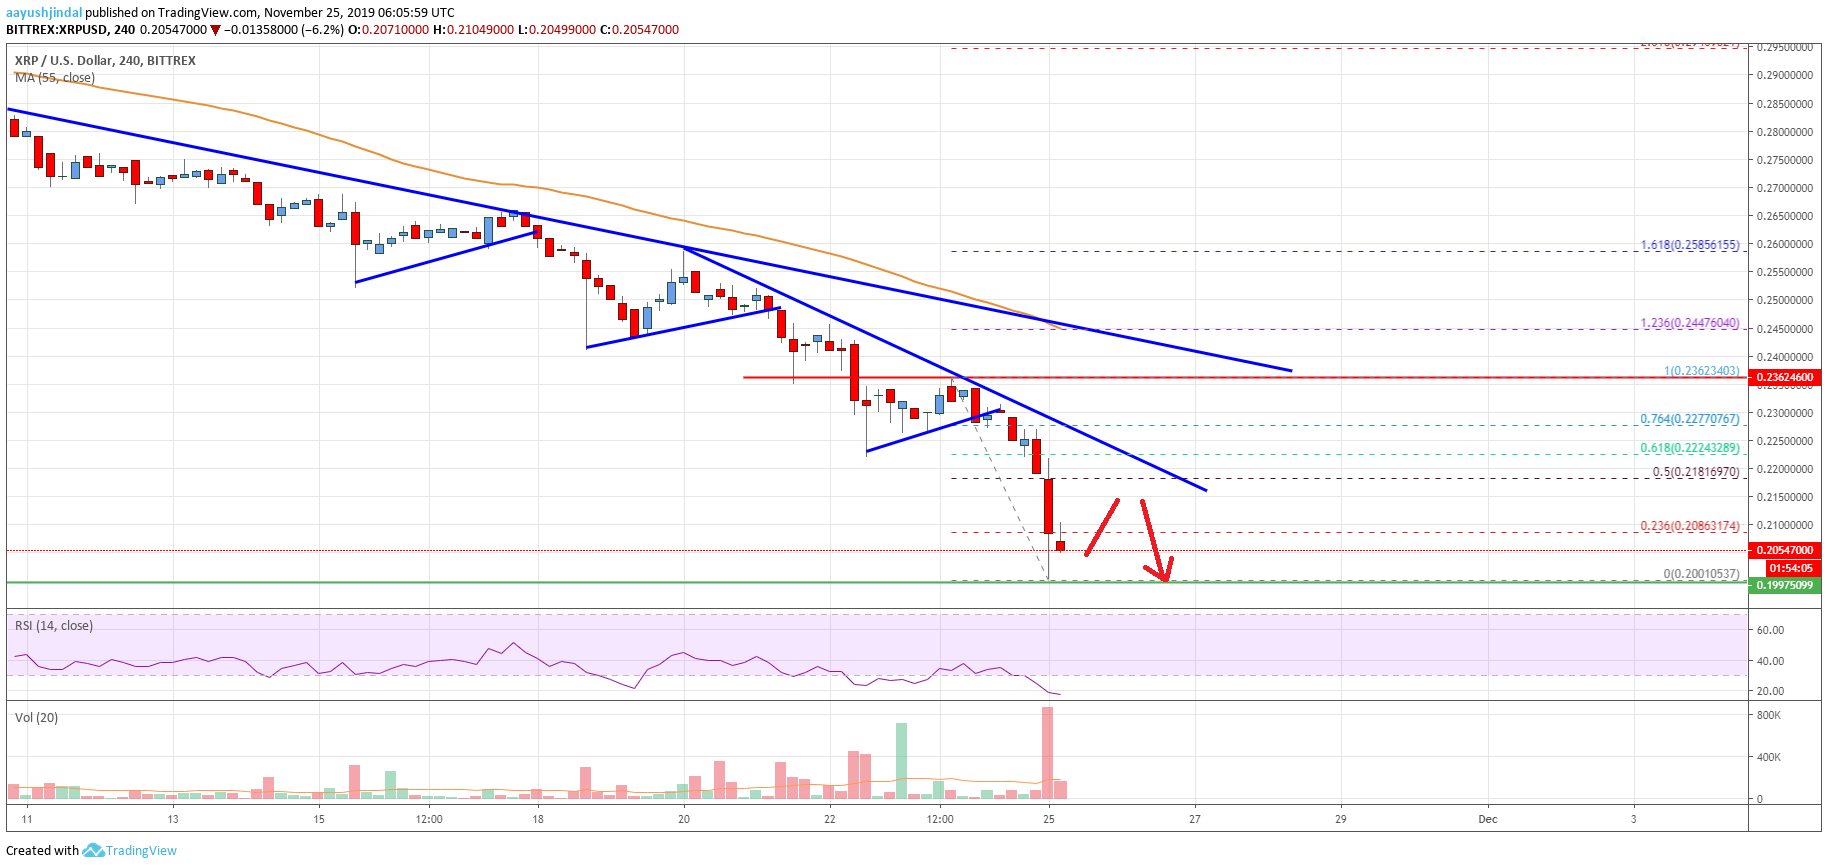
- There are two major bearish trend lines forming with resistance near $0.2185 and $0.2400 on the 4-hours chart of the XRP/USD pair (data source from Bittrex).
- The price is likely to decline further and it could even trade below the $0.2000 support.
Ripple price is tumbling below key supports against the US Dollar. XRP price might correct higher, but upsides are likely to remain capped by $0.2200.
Ripple Price Analysis
In the past few days, ripple price followed a strong downtrend below the $0.2800 and $0.2500 support levels against the US Dollar. Moreover, XRP/USD settled below the $0.2500 support and the 55 simple moving average (4-hours).
The decline gained pace below the $0.2340 support and the $0.2200 pivot level. Finally, the price broke the $0.2150 support area and traded to a new monthly low at $0.2001.
It is currently consolidating losses above the $0.2000 support area. An immediate resistance is near the $0.2085 level. It represents the 23.6% Fib retracement level of the downward slide from the $0.2362 high to $0.2001 low.
On the upsides, there are many barriers for buyers near $0.2150 and $0.2185. Besides, there are two major bearish trend lines forming with resistance near $0.2185 and $0.2400 on the 4-hours chart of the XRP/USD pair.
The first trend line is close to the 50% Fib retracement level of the downward slide from the $0.2362 high to $0.2001 low. Therefore, ripple price is likely to struggle near the $0.2185 and $0.2200 resistance levels.
To start a strong recovery and upward move, the price must break the second trend line, $0.2400, and the 55 simple moving average (4-hours).
If the price fails to correct above the mentioned hurdles, there is a risk of more losses below $0.2050 and $0.2000. Additionally, if the price fails to hold the $0.2000 support, the next major stop for the bulls may perhaps be near the $0.1960 level.

Looking at the chart, ripple price is clearly at a risk of more losses below the main $0.2000 support area. In the short term, there could be a minor upside correction, but sellers are likely to remain active near $0.2185 and $0.2200.
Technical indicators
4 hours MACD – The MACD for XRP/USD is currently gaining momentum in the bearish zone.
4 hours RSI (Relative Strength Index) – The RSI for XRP/USD is currently well below the 30 level, with oversold signs.
Key Support Levels – $0.2020, $0.2000 and $0.1960.
Key Resistance Levels – $0.2185 and $0.2200.


Leave a Reply
You must be logged in to post a comment.