- Ripple price started a fresh increase above the key $0.3880 resistance against the US dollar.
- The price broke the $0.4000 resistance area to move into a positive zone.
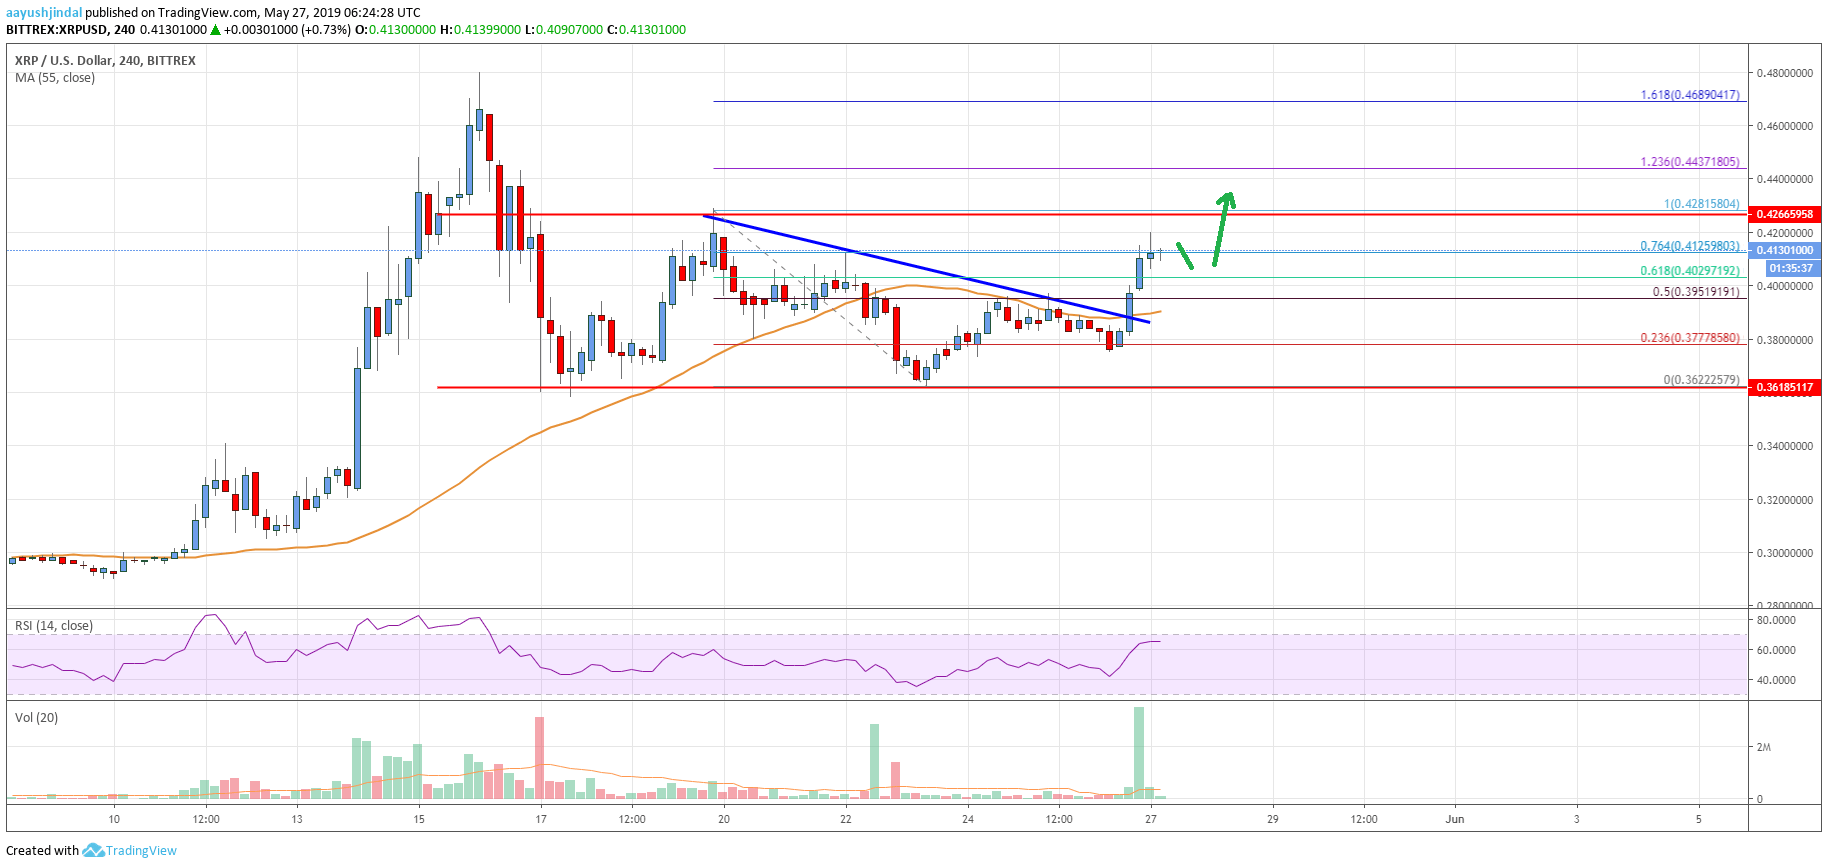
- There was a break above a major bearish trend line with resistance near $0.3880 on the 4-hours chart of the XRP/USD pair (data source from Bittrex).
- The price is currently gaining momentum and it is likely to climb above $0.4200 and $0.4400.
Ripple price is gaining momentum above $0.4100 against the US Dollar. XRP is likely to continue higher above $0.4200 and any dips remain supported near $0.4000.
Ripple Price Analysis
This past week, there was a downside correction in bitcoin, Ethereum, bitcoin cash, ADA and ripple against the US Dollar. The XRP/USD pair tested the $0.3600-0.3620 support area and later started a slow and steady rise. It broke the $0.3850 resistance level and the 23.6% Fib retracement level of the downward move from the $0.4281 high to $0.3622 swing low. However, the upward move was capped by the $0.3950 resistance and the 55 simple moving average (4-hours).
Recently, there was a fresh increase in buying interest, sparking bullish moves above $0.3850 and $0.3900. Moreover, there was a break above a major bearish trend line with resistance near $0.3880 on the 4-hours chart of the XRP/USD pair. The pair settled above the $0.3950 resistance and the 55 simple moving average (4-hours). Besides, the price spiked above the 76.4% Fib retracement level of the downward move from the $0.4281 high to $0.3622 swing low. If there is a clear break above the $0.4260 and $0.4300 resistance levels, there could be strong gains in the near term.
The next key resistance is near the $0.4450 level. It coincides with the 1.236 Fib extension level of the downward move from the $0.4281 high to $0.3622 swing low. Conversely, if there is a downside correction, the price may find support near the $0.4040 or $0.4020 level. The main support is near the $0.3950 level or the 55 simple moving average (4-hours). Therefore, if there is a downside correction, the price might find a strong buying interest near $0.4000.

Looking at the chart, ripple price is clearly trading with a positive bias above the $0.4000 pivot level. On the upside, a break above the $0.4250 and $0.4260 levels is must for upside continuation. If the bulls remain in action, there could be a push towards the $0.4450 level in the coming sessions.
Technical indicators
4 hours MACD – The MACD for XRP/USD is gaining momentum in the bullish zone.
4 hours RSI (Relative Strength Index) – The RSI for XRP/USD jumped above the 50 level, with a bullish angle.
Key Support Levels – $0.4020, $0.4000 and $0.3950.
Key Resistance Levels – $0.4260 and $0.4450.


Leave a Reply
You must be logged in to post a comment.