- Stellar lumen price extended losses this past week and traded below $0.1100 against the US Dollar.
- XLM price even broke the $0.1000 support and traded to a new monthly low at $0.0986.
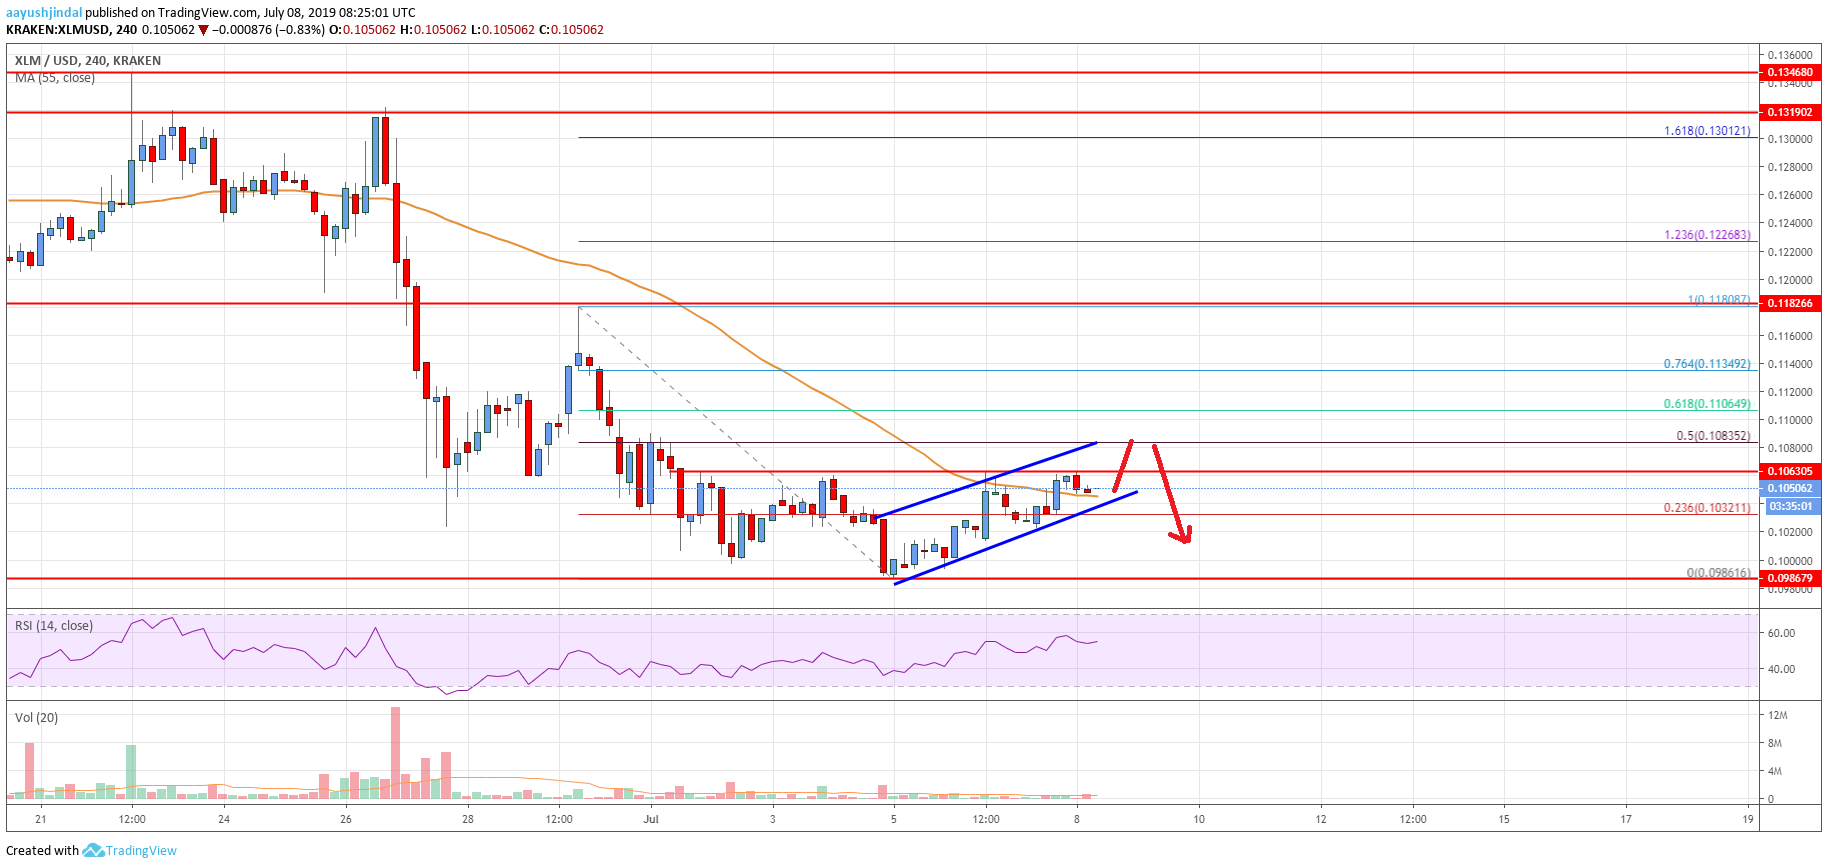
- There is a bearish flag forming with resistance near $0.1085 on the 4-hours chart (data feed via Kraken).
- The pair could either continue lower below $0.1020 or it may recover above $0.1100 in the near term.
Stellar lumen price remain in a bearish zone below the $0.1100 resistance against the US Dollar. XLM price might continue to decline if it fails to stay above the $0.1020 support.
Stellar Lumen Price Analysis (XLM to USD)
This past week, stellar lumen price remained in a bearish zone below $0.1150 against the US Dollar. The XLM/USD pair extended losses and broke the $0.1100 and $0.1050 support levels. Moreover, there was a close below $0.1050 and the 55 simple moving average (4-hours). Finally, the price spiked below the $0.1000 support level and traded to a new monthly low at $0.0986.
Recently, it started an upside correction above the $0.1000 level. The price broke the 23.6% Fibonacci retracement level of the last slide from the $0.1180 high to $0.0986 low. However, the $0.1060 and $0.1065 levels are currently preventing further gains. More importantly, there is a bearish flag forming with resistance near $0.1085 on the 4-hours chart. Therefore, on the upside, there is a strong resistance forming near $0.1085 and $0.1100.
The 50% Fibonacci retracement level of the last slide from the $0.1180 high to $0.0986 low is also near the $0.1083 level. Therefore, a successful close above the $0.1085 and $0.1100 levels is needed to start a decent recovery. The next important resistance is near the $0.1135, above which the price could revisit the $0.1150 and $0.1180 levels.
Conversely, if it’s a real bearish flag, there could be a downside break below the $0.1020 support. If the bulls fail to defend the $0.1020 and $0.1000 support levels, the price could even break the $0.0986 swing low. The next support is near the $0.0950 level, where the bulls might take a stand.

The chart indicates that XLM price is slowly recovering above $0.1040, but it facing a lot of hurdles near the $0.1085 and $0.1100 levels. As long as it is below $0.1085 and $0.1100, there is a risk of more losses in the coming sessions.
Technical Indicators
4 hours MACD – The MACD for XLM/USD is slowly moving into the bullish zone, with a positive bias.
4 hours RSI – The RSI for XLM/USD is currently just above the 50 level, with a flat structure.
Key Support Levels – $0.1020 and $0.1000.
Key Resistance Levels – $0.1065, $0.1085 and $0.1100.


Leave a Reply
You must be logged in to post a comment.