
- Stellar lumen price started a fresh decline from the $0.122 resistance against the US Dollar.
- XLM price is now trading below $0.1200 and the 55 simple moving average (4-hours).
- There is a major bearish trend line forming with resistance near $0.1140 on the 4-hours chart (data feed via Kraken).
- The pair could continue to decline towards the $0.1000 support zone in the near term.
Stellar lumen price is trading well below $0.1200 against the US Dollar, similar to bitcoin. XLM price must stay above the $0.1000 support to avoid a larger decline.
Stellar Lumen Price Analysis (XLM to USD)
After a struggle near the $0.1220 level, stellar lumen price saw a fresh decline against the US Dollar. The XLM/USD pair traded below the $0.1100 support level to enter a bearish zone.
There was a clear move below the $0.1050 level and the 55 simple moving average (4-hours). A low was formed near $0.1000 and the price is now correcting losses. There was a move above the $0.1100 resistance zone. The price climbed above the 50% Fib retracement level of the downward move from the $0.1228 swing high to $0.1000 low.
On the upside, the price is facing resistance near the $0.1120 zone. There is also a major bearish trend line forming with resistance near $0.1140 on the 4-hours chart.
The trend line is near the 61.8% Fib retracement level of the downward move from the $0.1228 swing high to $0.1000 low. The next major resistance is near the $0.1180 level. A clear move above the $0.1200 level might send the price towards the $0.1320 level. Any more gains could lead the price towards the $0.1500 level.
An initial support on the downside is near the $0.1080 level. The main support is near the $0.1000 zone. Any more losses could lead the price towards the $0.0920 level in the near term, below which the price might even test $0.085.
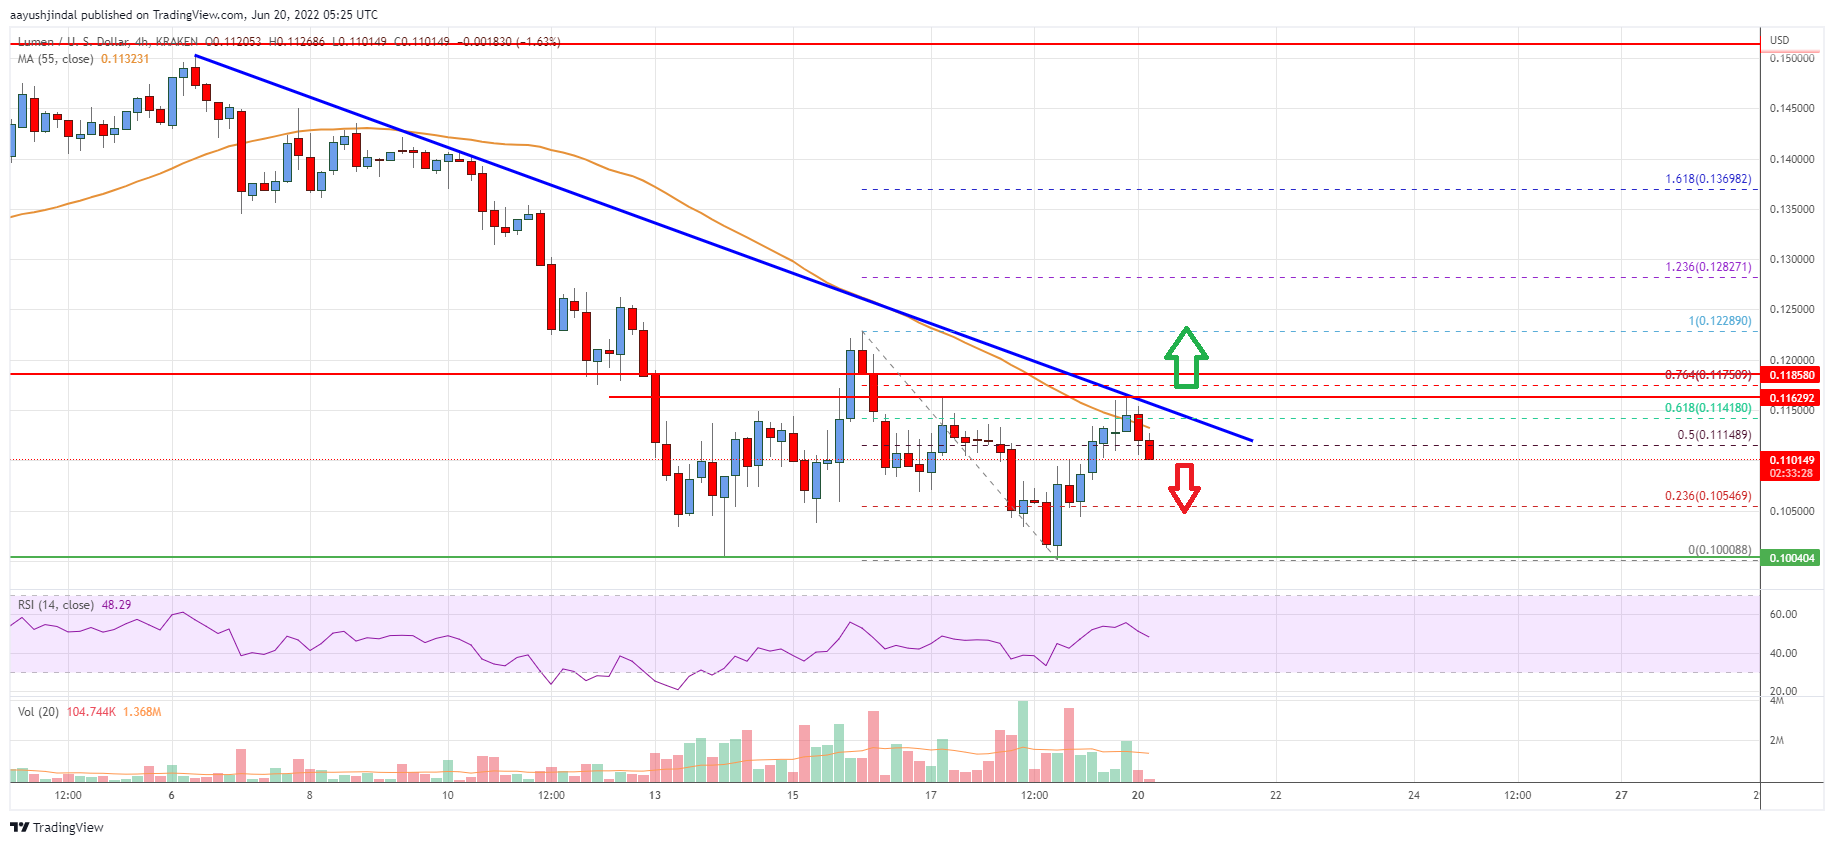
The chart indicates that XLM price is now trading below $0.1200 and the 55 simple moving average (4-hours). Overall, the price could continue to decline towards the $0.1000 support zone in the near term.
Technical Indicators
4 hours MACD – The MACD for XLM/USD is gaining momentum in the bearish zone.
4 hours RSI – The RSI for XLM/USD is now near the 50 level.
Key Support Levels – $0.1080 and $0.1000.
Key Resistance Levels – $0.1140, $0.1180 and $0.1200.


Leave a Reply
You must be logged in to post a comment.