
- Stellar lumen price recovered above $0.0400, but it failed near $0.0450 against the US Dollar.
- XLM price is currently declining and it is struggling to stay above the $0.0360 support.
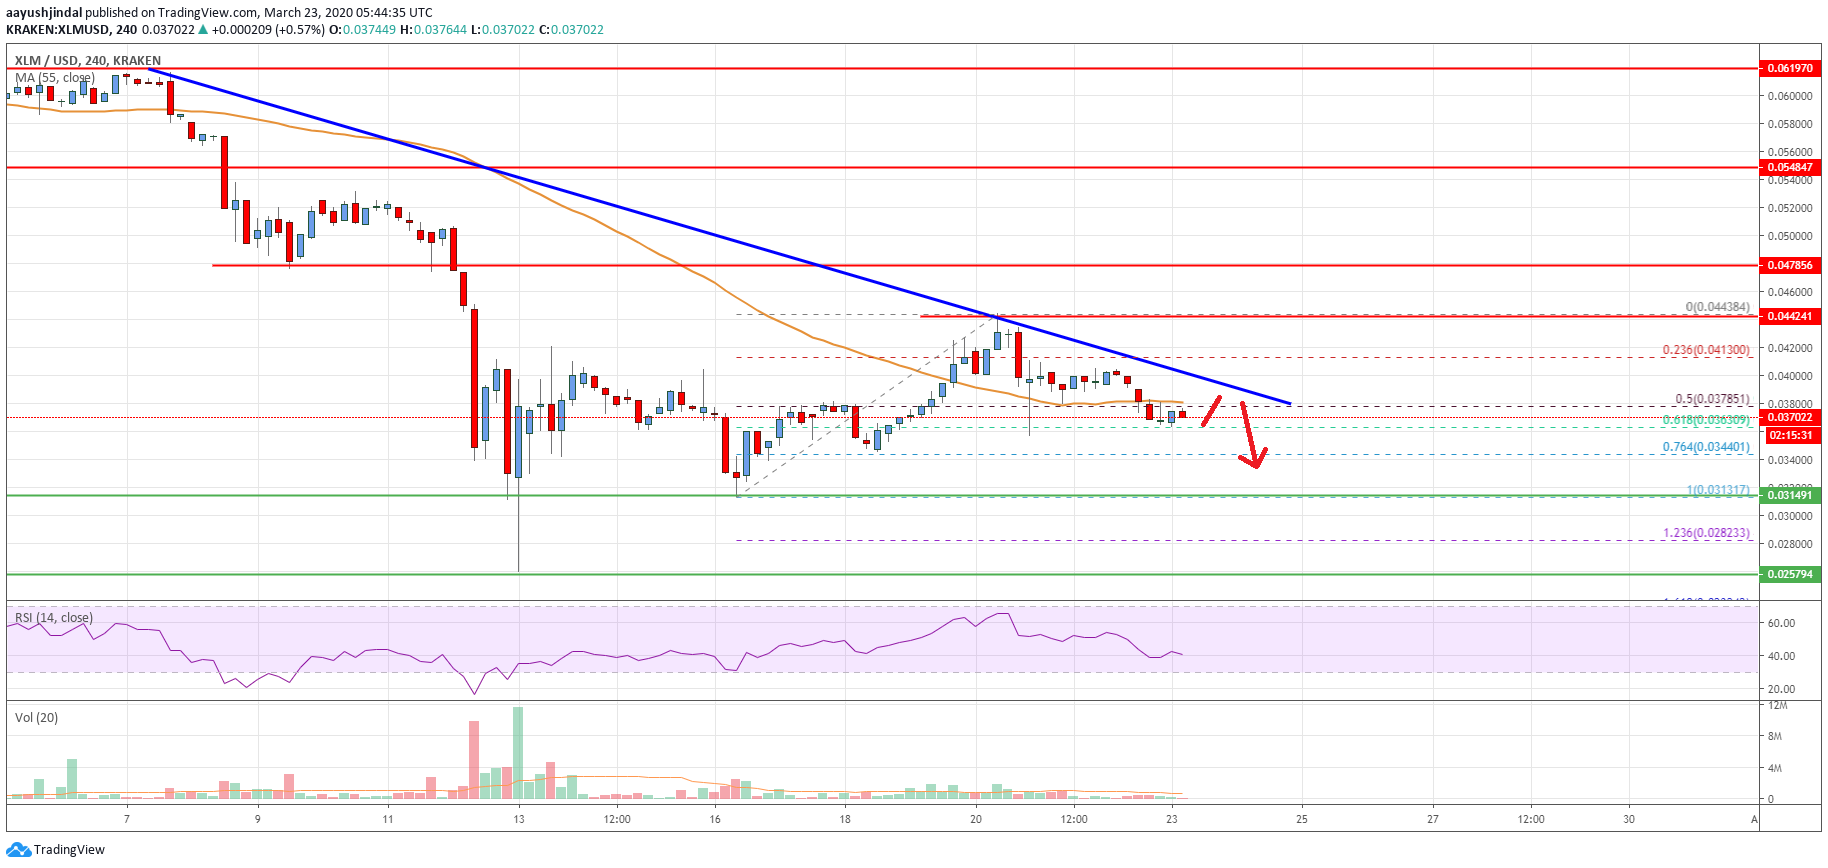
- There is a key bearish trend line forming with resistance near $0.0400 on the 4-hours chart (data feed via Kraken).
- The pair is likely to extend its decline as long as it is trading below the $0.0450 pivot.
Stellar lumen price is trading in a bearish zone against the US Dollar and bitcoin. XLM price is likely to continue lower towards the $0.0350 and $0.0320 supports in the near term.
Stellar Lumen Price Analysis (XLM to USD)
This past week, there was a decent recovery wave in stellar lumen price above $0.0400 against the US Dollar. The XLM/USD pair even broke the $0.0420 resistance level and the 55 simple moving average (4-hours).
However, the price struggled to extend its rise above the $0.0450 resistance area. A swing high is formed near $0.0443 and the price is currently declining. There was a break below the $0.0400 level and the 55 simple moving average (4-hours).
Besides, the price traded below the 50% Fibonacci retracement level of the upward move from the $0.0313 low to $0.0443 high. On the downside, an initial support is seen near the $0.0360 level.
The 61.8% Fibonacci retracement level of the upward move from the $0.0313 low to $0.0443 high is also near the $0.0360 level to act as a key support zone. Any further losses may perhaps spark a sharp decline towards the $0.0320 level in the near term.
On the upside, an initial resistance is near the $0.0380 level and the 55 SMA. There is also a key bearish trend line forming with resistance near $0.0400 on the 4-hours chart.
A clear break above the trend line resistance could lead the price towards $0.0400. The main resistance on the upside is still near the $0.0450 level. Any further gains is likely to improve the market sentiment and the price might surge towards $0.0500.
The chart indicates that XLM price is trading in a bearish zone below $0.0400 and $0.0450. Therefore, there is a risk of more losses below the $0.0350 and $0.0320 levels in the near term.
Technical Indicators
4 hours MACD – The MACD for XLM/USD is currently gaining pace in the bearish zone.
4 hours RSI – The RSI for XLM/USD is now well below the 50 level.
Key Support Levels – $0.0350 and $0.0320.
Key Resistance Levels – $0.0400, $0.0450 and $0.0480.


Leave a Reply
You must be logged in to post a comment.