
- Stellar lumen price struggled to clear the $0.3500 resistance zone against the US Dollar.
- XLM price is now trading below $0.3000 and the 55 simple moving average (4-hours).
- There is a major bearish trend line forming with resistance near $0.3080 on the 4-hours chart (data feed via Kraken).
- The pair is likely to extend its decline as long as it is below the $0.3500 resistance level.
Stellar lumen price is facing hurdles near $0.3200 and $0.3500 against the US Dollar, similar to bitcoin. XLM price could decline heavily below the $0.2500 support zone.
Stellar Lumen Price Analysis (XLM to USD)
After a strong decline, stellar lumen price started an upside correction from $0.3000 against the US Dollar. However, the XLM/USD pair failed to clear the $0.3500 resistance zone.
As a result, the price started a fresh decline from the $0.3500 resistance zone. There was a break below the $0.3200 and $0.3000 support levels. It is now trading below $0.3000 and the 55 simple moving average (4-hours). A low is formed near $0.2701 and the price is now correcting higher.
It broke the 23.6% Fibonacci retracement level of the recent decline from the $0.3494 high to $0.2701 low. The price is now facing resistance near the $0.3000 zone.
There is also a major bearish trend line forming with resistance near $0.3080 on the 4-hours chart. The trend line is also close to the 50% Fibonacci retracement level of the recent decline from the $0.3494 high to $0.2701 low.
The next key resistance could be $0.3200 or the 55 simple moving average (4-hours). The main resistance is still near the $0.3500 zone.
An initial support on the downside is near the $0.2700 zone. Any more losses might call for a drop towards the $0.2500 support zone. A downside break below the $0.2500 support could spark a sharp decline in the coming days.
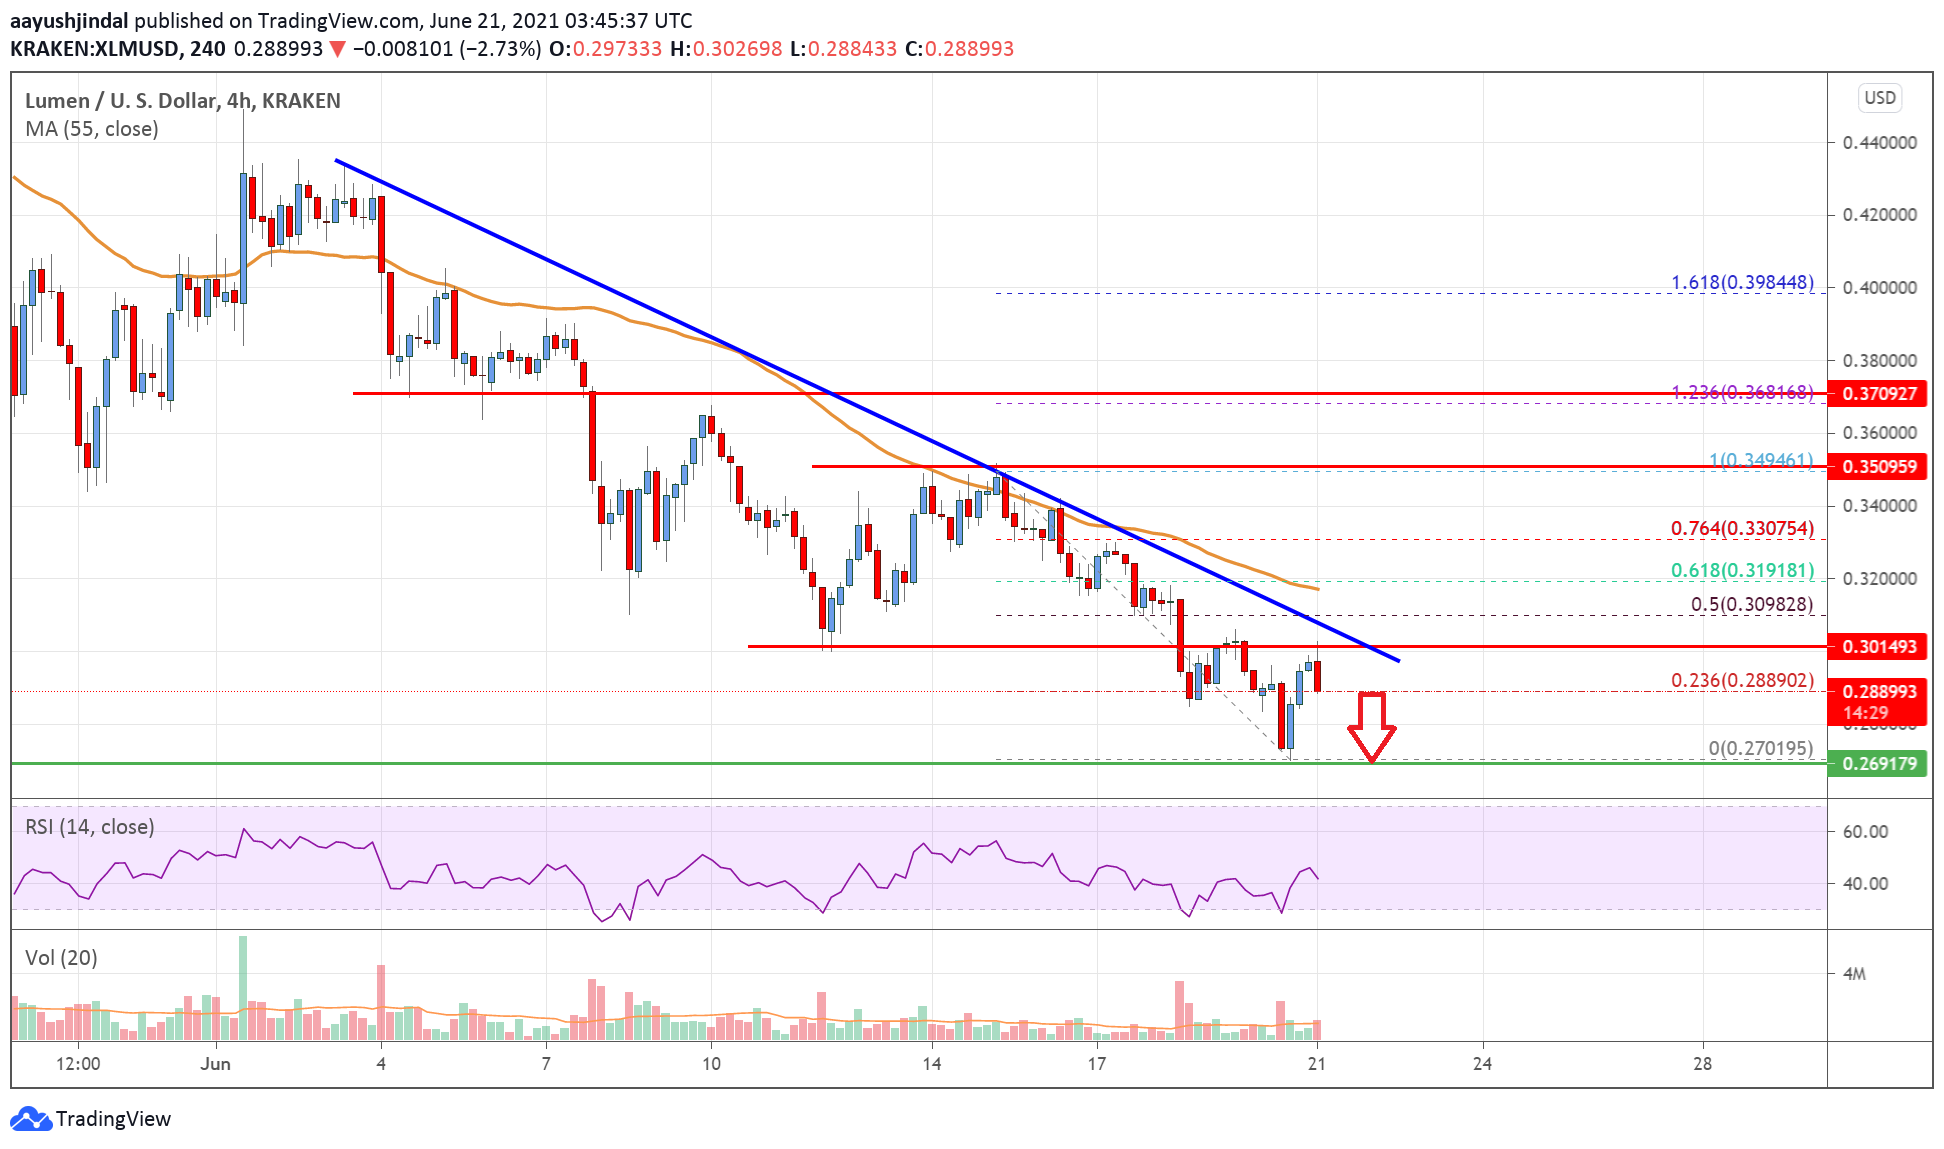
The chart indicates that XLM price is clearly trading well below $0.3200 and the 55 simple moving average (4-hours). Overall, the price is likely to extend its decline as long as it is below the $0.3500 resistance level in the near term.
Technical Indicators
4 hours MACD – The MACD for XLM/USD is slowly gaining momentum in the bearish zone.
4 hours RSI – The RSI for XLM/USD is currently below the 50 level.
Key Support Levels – $0.2700 and $0.2500.
Key Resistance Levels – $0.3000, $0.3200 and $0.3500.


Leave a Reply
You must be logged in to post a comment.