Tag: miota

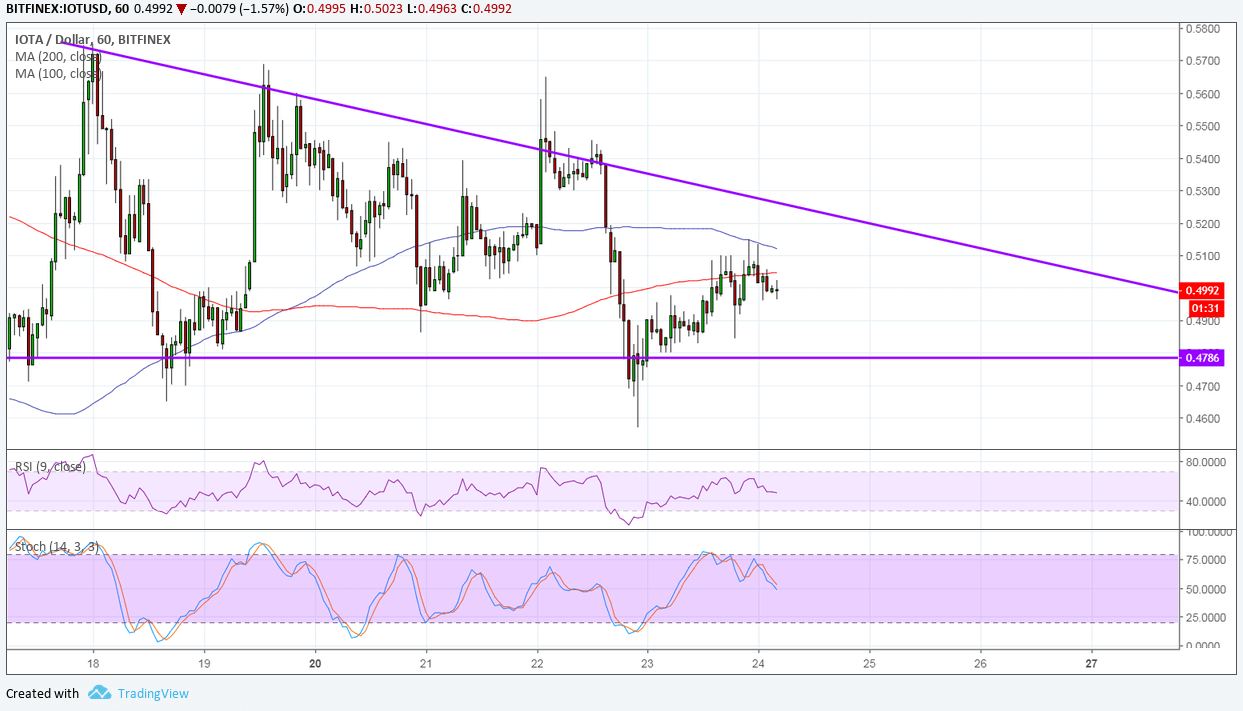
IOTA Price Analysis: IOT/USD Descending Triangle Pattern
IOTA has formed lower highs and found support around 0.4800 to create a descending triangle pattern on its 1-hour chart. Price just bounced off support…

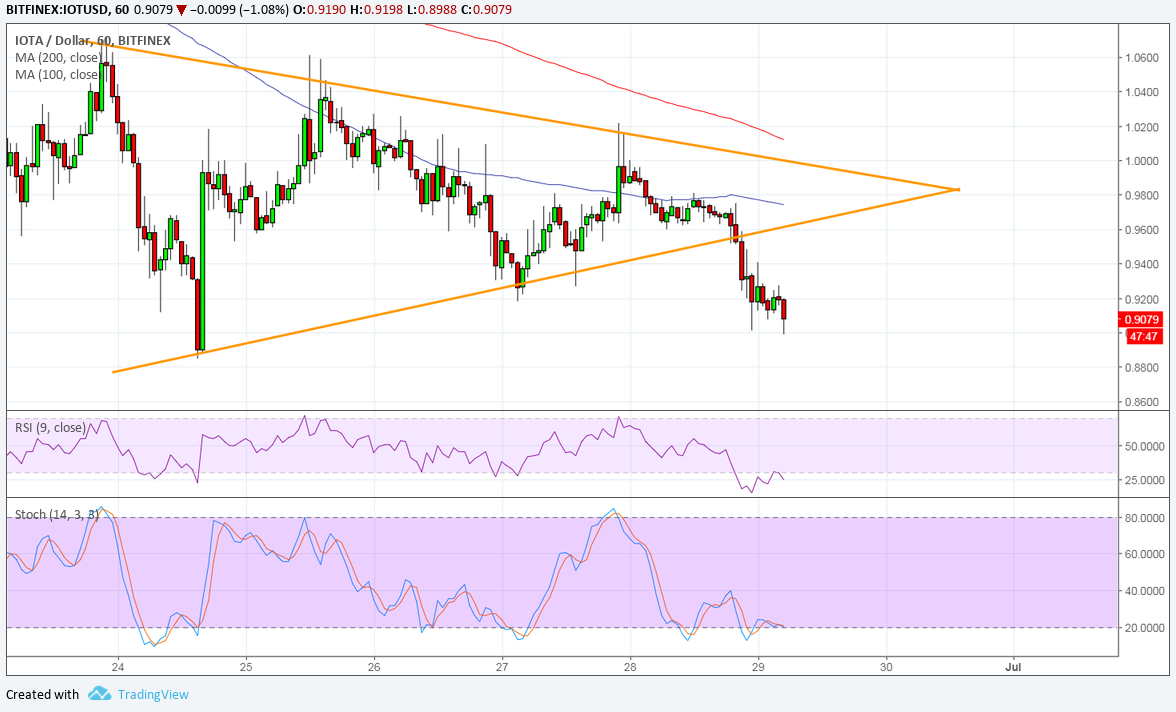
IOTA Technical Analysis for 06/29/2018 – Short-Term Triangle Break
IOTA broke down from its symmetrical triangle consolidation pattern to signal that further losses are in the cards. The chart pattern spans 0.8800 to 1.0600…

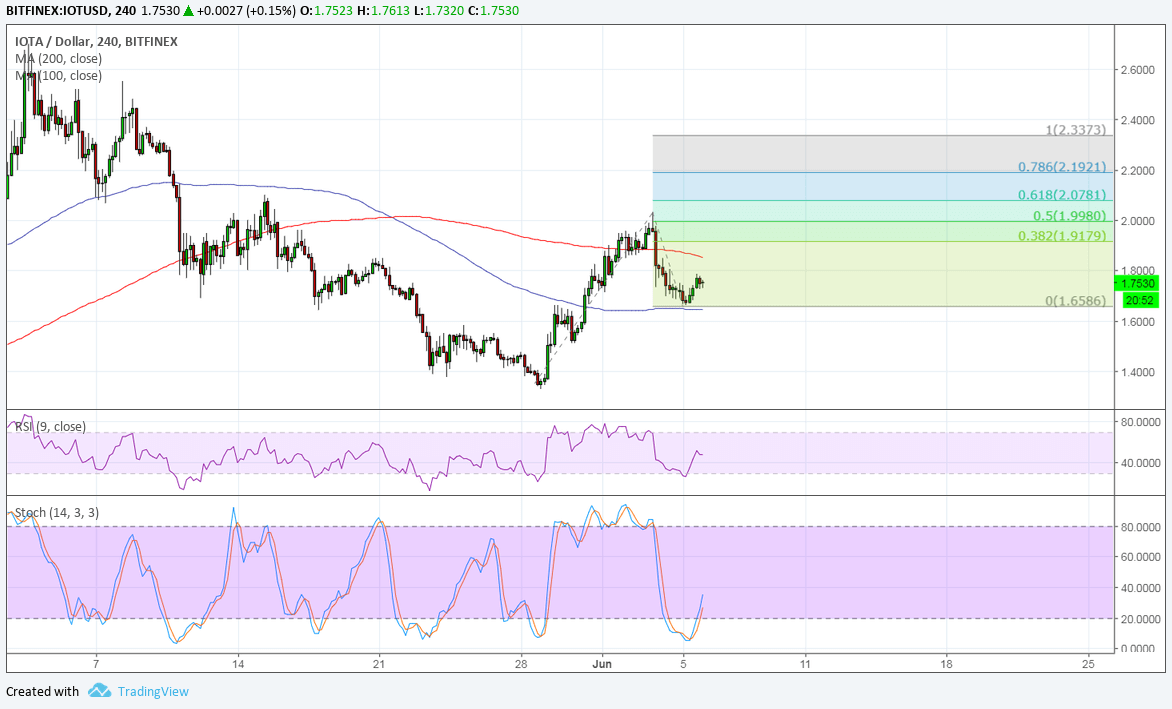
IOTA Technical Analysis for 06/06/2018 – Reversal Pattern Confirmation
IOTA appears to be completing a reversal pattern on its 4-hour time frame and could be due for a move to the extension levels next.…
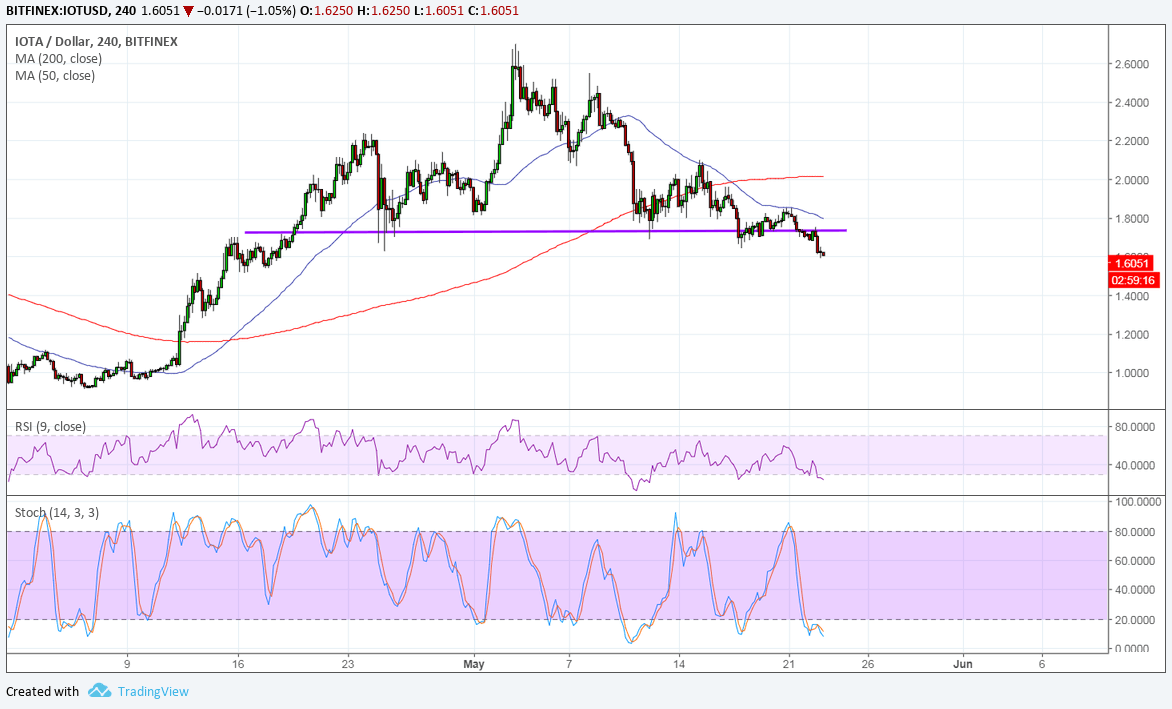
IOTA Technical Analysis for 05/23/2018 – Reversal Pattern Confirmation
IOTA broke below the neckline of its head and shoulders pattern to signal that a downtrend is underway. This chart pattern spans 1.8000 to 2.6000…

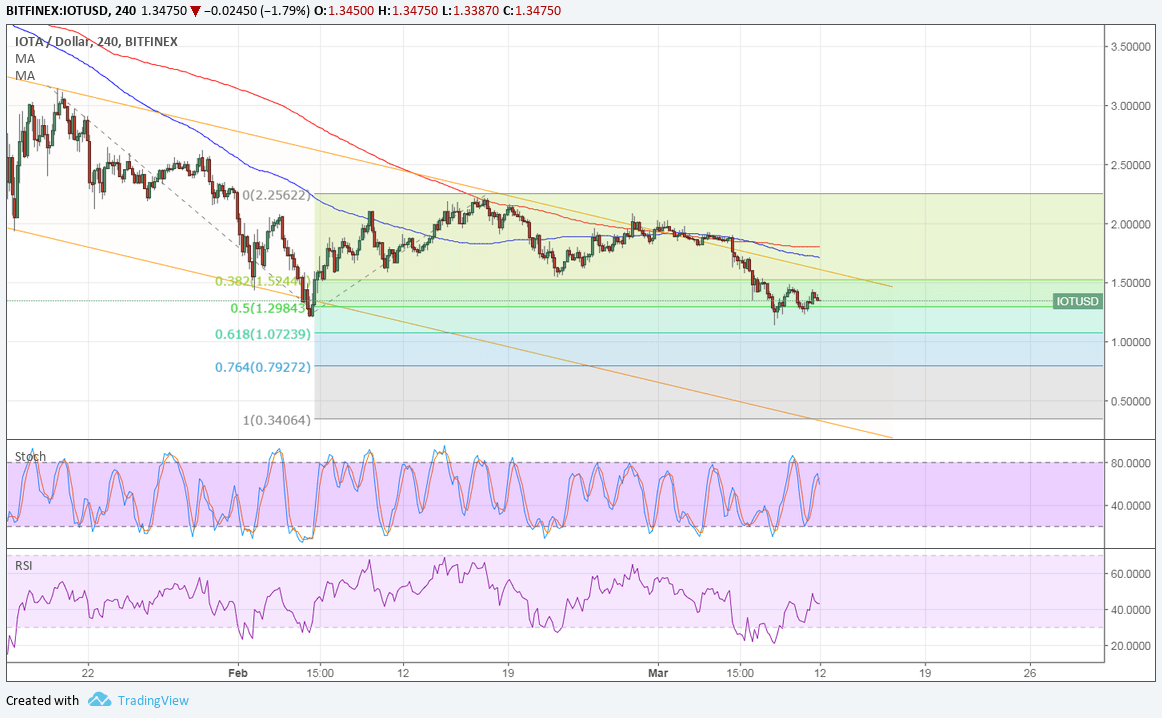
IOTA Technical Analysis for 03/12/2018 – Bearish Trend Channels
IOTA continues to trend lower as the cryptocurrency industry has faced several setbacks last week. Against bitcoin, IOTA is in a downtrend channel and is…