- Tron price regained strength and recently traded above the key $0.0358 resistance against the US Dollar.
- TRX price is now trading above the $0.0380 level and it may soon test the $0.0400 level.
- There is a rising channel in place with support near $0.0385 on the 4-hours chart (data feed via Bitfinex).
- The price is likely to gain momentum towards the $0.0420 and $0.0440 levels in the near term.
TRON price is showing a lot of positive signs above $0.0380 against the US Dollar, but struggled vs bitcoin. TRX price must continue to rise as long as BTC remains in an uptrend.
Tron Price Analysis
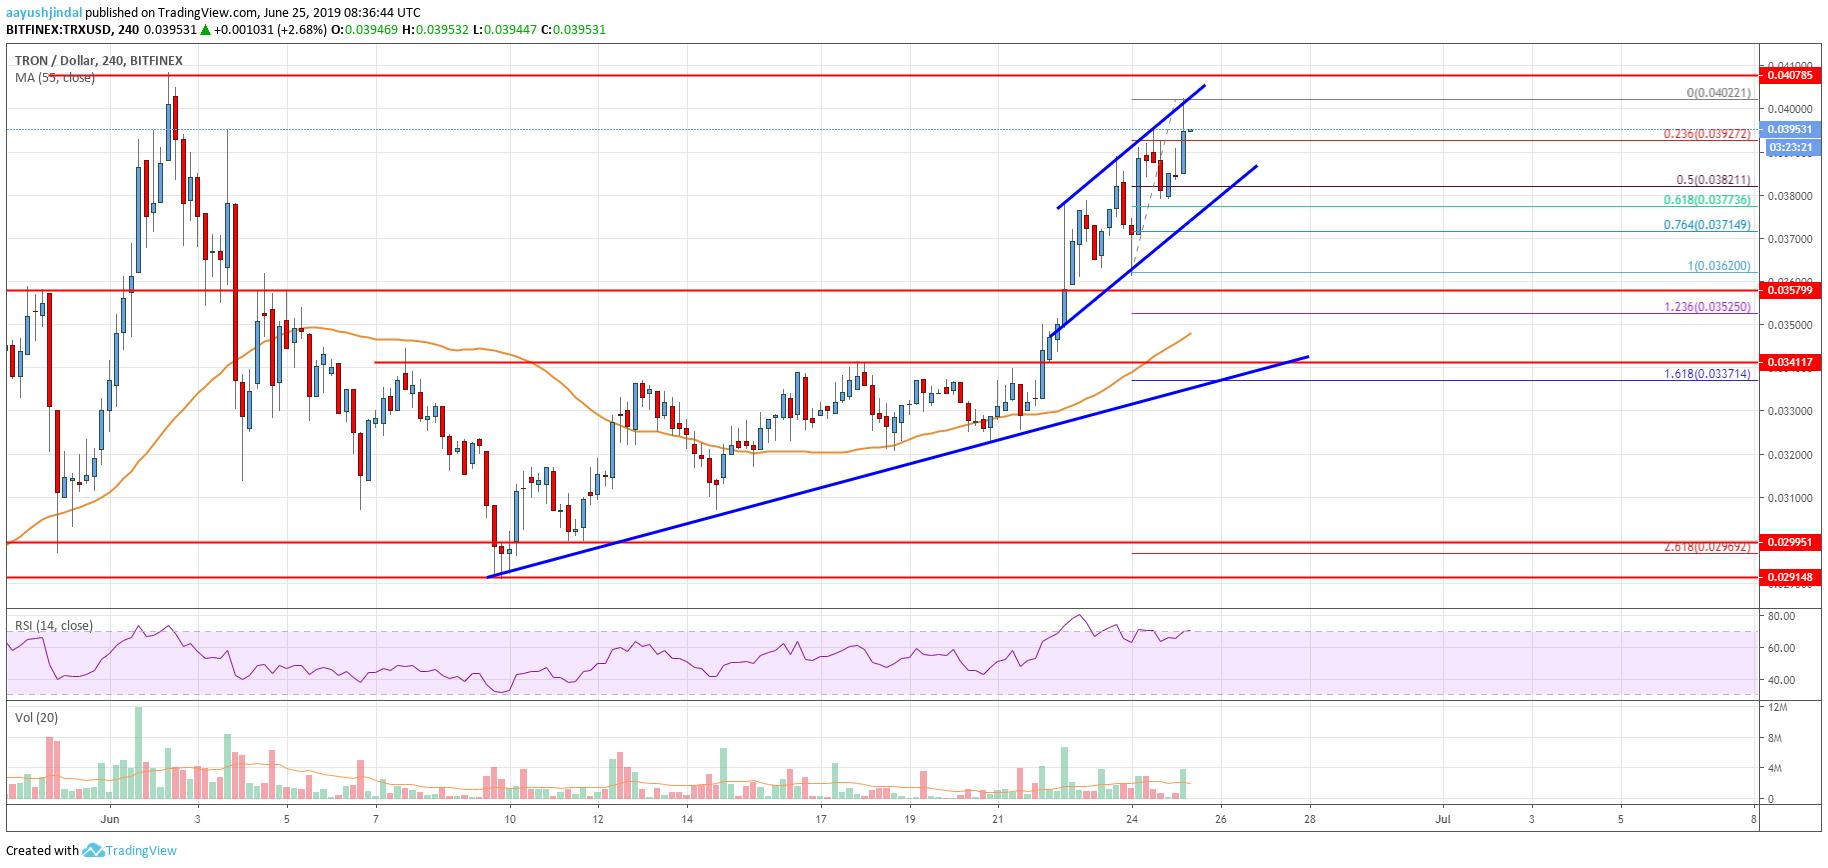
This past week, there was an important break in TRON price above the $0.0340 resistance against the US Dollar. The TRX/USD pair gained strength and traded above the $0.0350 resistance plus the 55 simple moving average (4-hours). The upward move was such that the price even broke the $0.0362 and $0.0370 levels. The price is now trading well above the $0.0380 level and the $0.0390 pivot level.
An initial support is near the $0.0392 level. It represents the 23.6% Fibonacci retracement level of the last wave from the $0.0362 low $0.0402 high. Moreover, there is a rising channel in place with support near $0.0385 on the 4-hours chart. The channel support coincides with the 50% Fibonacci retracement level of the last wave from the $0.0362 low $0.0402 high.
If there is a downside break below the channel support, the price could slide towards the $0.0340 support. There is also a crucial trend line placed near the $0.0350 level and the 55 simple moving average (4-hours). Besides, the 1.236 Fib extension level of the last wave from the $0.0362 low $0.0402 high is also near the $0.0352 to provide support.
On the upside, an immediate resistance is near the $0.0400 level. The current structure suggests that the price is likely to surpass the $0.0405 and $0.0410 levels. The next stop in the mentioned case could be near the $0.0420 level. Any further gains would call for a push towards the $0.0440 level.

The chart indicates that TRX price is trading with a positive bias above the $0.0380 support area. As long as the price is following the rising channel, it could climb above $0.0400 and $0.0405. Finally, a successful close above the $0.0408 level might set the pace for a push towards the $0.0420 and $0.0440 levels.
Technical Indicators
4 hours MACD – The MACD for TRX/USD is slowly gaining momentum in the bullish zone.
4 hours RSI – The RSI for TRX/USD is currently near the 70 level, with a bullish angle.
Key Support Levels – $0.0385 and $0.0355.
Key Resistance Levels – $0.0400, $0.0408 and $0.0420.


