- Tron price topped near the $0.0325 level and started a fresh decline against the US Dollar.
- TRX price is now trading well below $0.0312, but it is near the 55 simple moving average (4-hours).
- There is a major bullish trend line forming with support near $0.0291 on the 4-hours chart (data feed via Bitfinex).
- The pair could decline heavily if there is a clear close below $0.0290 and $0.0285 in the near term.
TRON price is showing bearish signs below $0.0320 and $0.0325 against the US Dollar, similar to bitcoin. TRX price could start a fresh increase as long as there is no daily close below $0.0285.
Tron Price Analysis
In the past few days, there was a slow increase in TRON price above the $0.0285 and $0.0292 resistance levels against the US Dollar. TRX price even broke the $0.0300 level and the 55 simple moving average (4-hours).
However, the price struggled to clear the $0.0325 resistance level. A high was formed near $0.0324 and the price started a fresh decline. It now trading well below $0.0312, but it is near the 55 simple moving average (4-hours).
There was a break below the 50% Fib retracement level of the upward move from the $0.0291 swing low to $0.0324 high. An initial support is near the $0.0300 level and the 55 simple moving average (4-hours).
It is close to the 76.4% Fib retracement level of the upward move from the $0.0291 swing low to $0.0324 high. Moreover, there is a major bullish trend line forming with support near $0.0291 on the 4-hours chart. If there is a downside break below the trend line support, the price could slide towards $0.0285.
Any more losses might lead the price towards the main $0.0265 support zone. To start a fresh increase, the price must clear the $0.0310 and $0.0325 resistance levels. The next major hurdle for the bulls could be $0.0365, where the bears might appear.
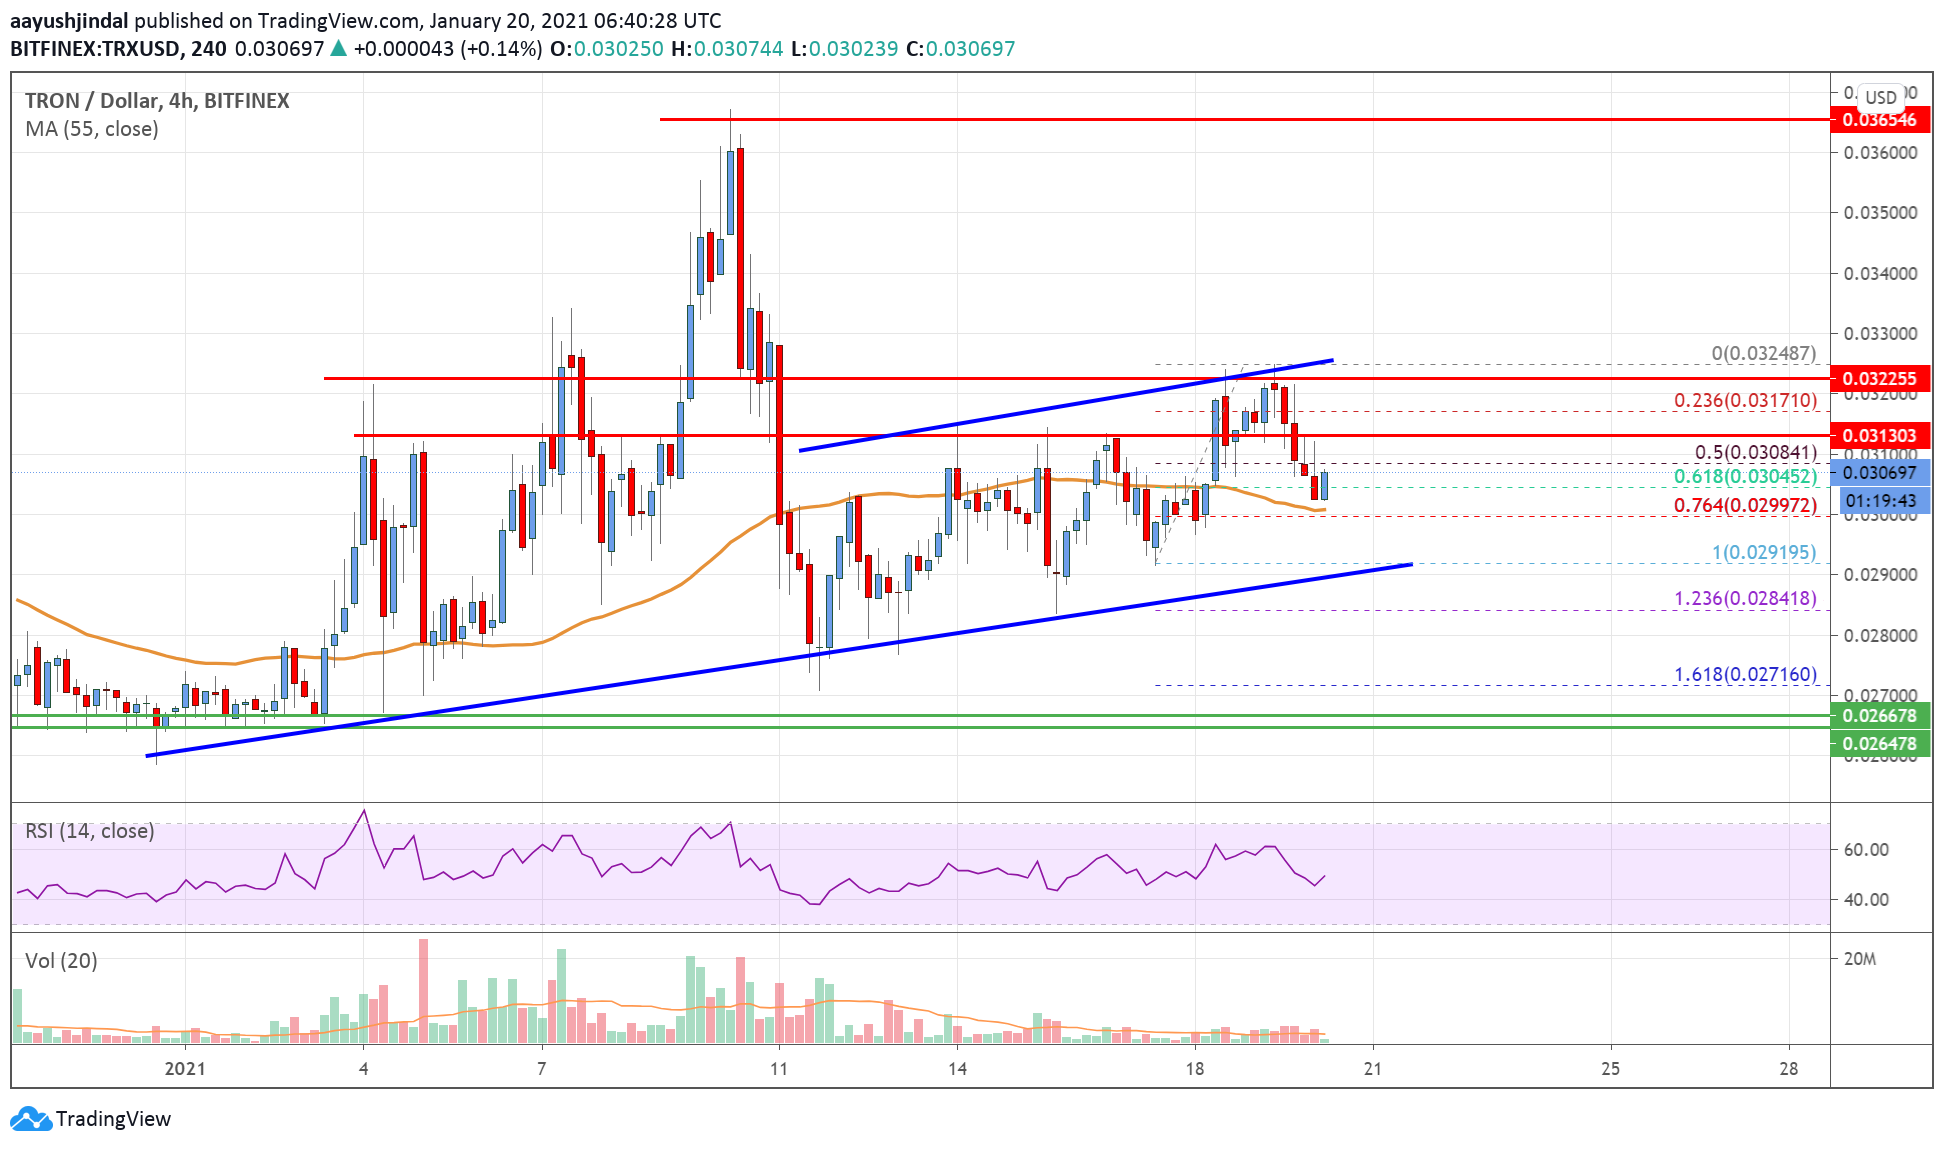
The chart indicates that TRX price is clearly struggling to gain above $0.0325, but it is above $0.0285. Overall, the price could decline heavily if there is a clear close below $0.0290 and $0.0285 in the near term.
Technical Indicators
4 hours MACD – The MACD for TRX/USD is slowly gaining momentum in the bearish zone.
4 hours RSI – The RSI for TRX/USD is now below the 50 level.
Key Support Levels – $0.0285 and $0.0265.
Key Resistance Levels – $0.0312, $0.0325 and $0.0350.