
XRP ETF clients add $3.87M, lifting total net assets to $1.4B as XRP holds near $1.40 support with key resistance at $1.74.
XRP ETF clients bought another $3.87 million worth of XRP, bringing total ETF-held net assets to $1.4 billion.
The fresh inflow comes as XRP trades near $1.40, close to a key support area on the daily chart.
XRP ETF Demand Adds to Market Focus
XRP ETF clients added $3.87 million in new purchases, according to the reported data. Total XRP ETF net assets now stand at $1.4 billion.
The update drew attention because XRP remains under pressure on higher time frames.
ETF demand shows continued exposure through regulated products, even as spot price action stays weak.
JUST IN: ETF clients buy $3.87 million worth of $XRP, bringing total ETF-held net assets to $1.4 billion. pic.twitter.com/BaZkZlSUAL
— Whale Insider (@WhaleInsider) May 5, 2026
The latest purchase does not change the chart trend by itself. However, it adds another data point for traders watching institutional demand and XRP liquidity.
Market participants often track ETF flows because they show demand outside direct exchange buying. This can help measure broader interest in XRP investment products.
XRP Price Holds Near Key Support
XRP was trading near $1.40 on the daily chart. This level sits close to the main support zone between $1.36 and $1.40.
The same area has acted as a key price floor after the recent decline. A daily close below $1.36 would weaken the current structure.
On the upside, XRP faces its first major resistance near $1.74. That level matches the 0.786 Fibonacci retracement shown on the chart.
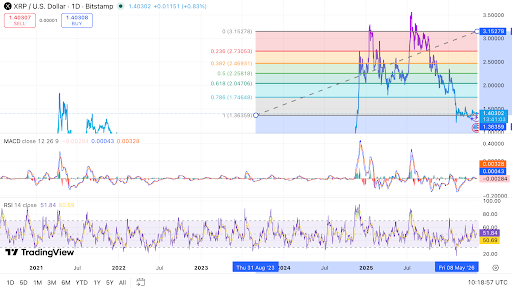
Further resistance sits near $2.05, $2.26, $2.47, $2.73, and $3.15. The wider resistance zone remains between $2.73 and $3.15.
The chart still shows a bearish trend from the prior highs near $3.15 to $3.50. XRP has formed lower highs and lower lows since that area.
The MACD remains close to the zero line. This shows that selling pressure has slowed, but buying momentum remains limited.
The RSI is near 51, which is neutral. A move above 60 to 65 would show stronger buyer activity.
Read Also:
Trader Positioning Shows Long Bias
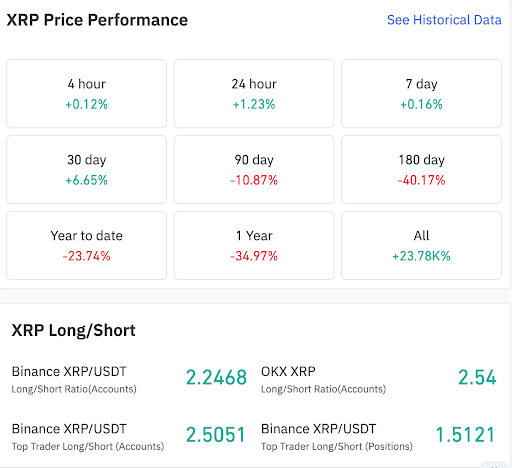
XRP long and short data shows that traders are leaning toward long positions. Binance XRP/USDT accounts showed a long/short ratio of 2.252.
OKX XRP accounts showed a higher ratio of 2.56. Binance top trader accounts were also long-biased at 2.5186.
Binance top trader positions showed a ratio of 1.5147. This means larger traders also held more long exposure than short exposure.
A ratio above one means more accounts or positions are long than short. These readings show that many traders expect a recovery.
However, crowded long positioning can create risk during a support break. If XRP drops below $1.36, liquidations may add pressure.
XRP’s recent performance remains mixed across time frames. It gained 6.61% over 30 days, but lost 10.91% over 90 days.
The token also fell 40.20% over 180 days and 35.00% over one year. This shows that the broader trend remains weak.


Leave a Reply
You must be logged in to post a comment.