- Bitcoin cash price started a major increase above the $550 zone against the US Dollar.
- The price is now trading above the $550 zone and the 55 simple moving average (4-hours).
- There is a key bullish trend line forming with support near $580 on the 4-hours chart of the BCH/USD pair (data feed from Coinbase).
- The pair is correcting gains, but dips could be limited below the $550 level.
Bitcoin cash price is showing positive signs above $550 against the US Dollar, similar to bitcoin. BCH/USD could resume its increase as long as it is above $550.
Bitcoin Cash Price Analysis
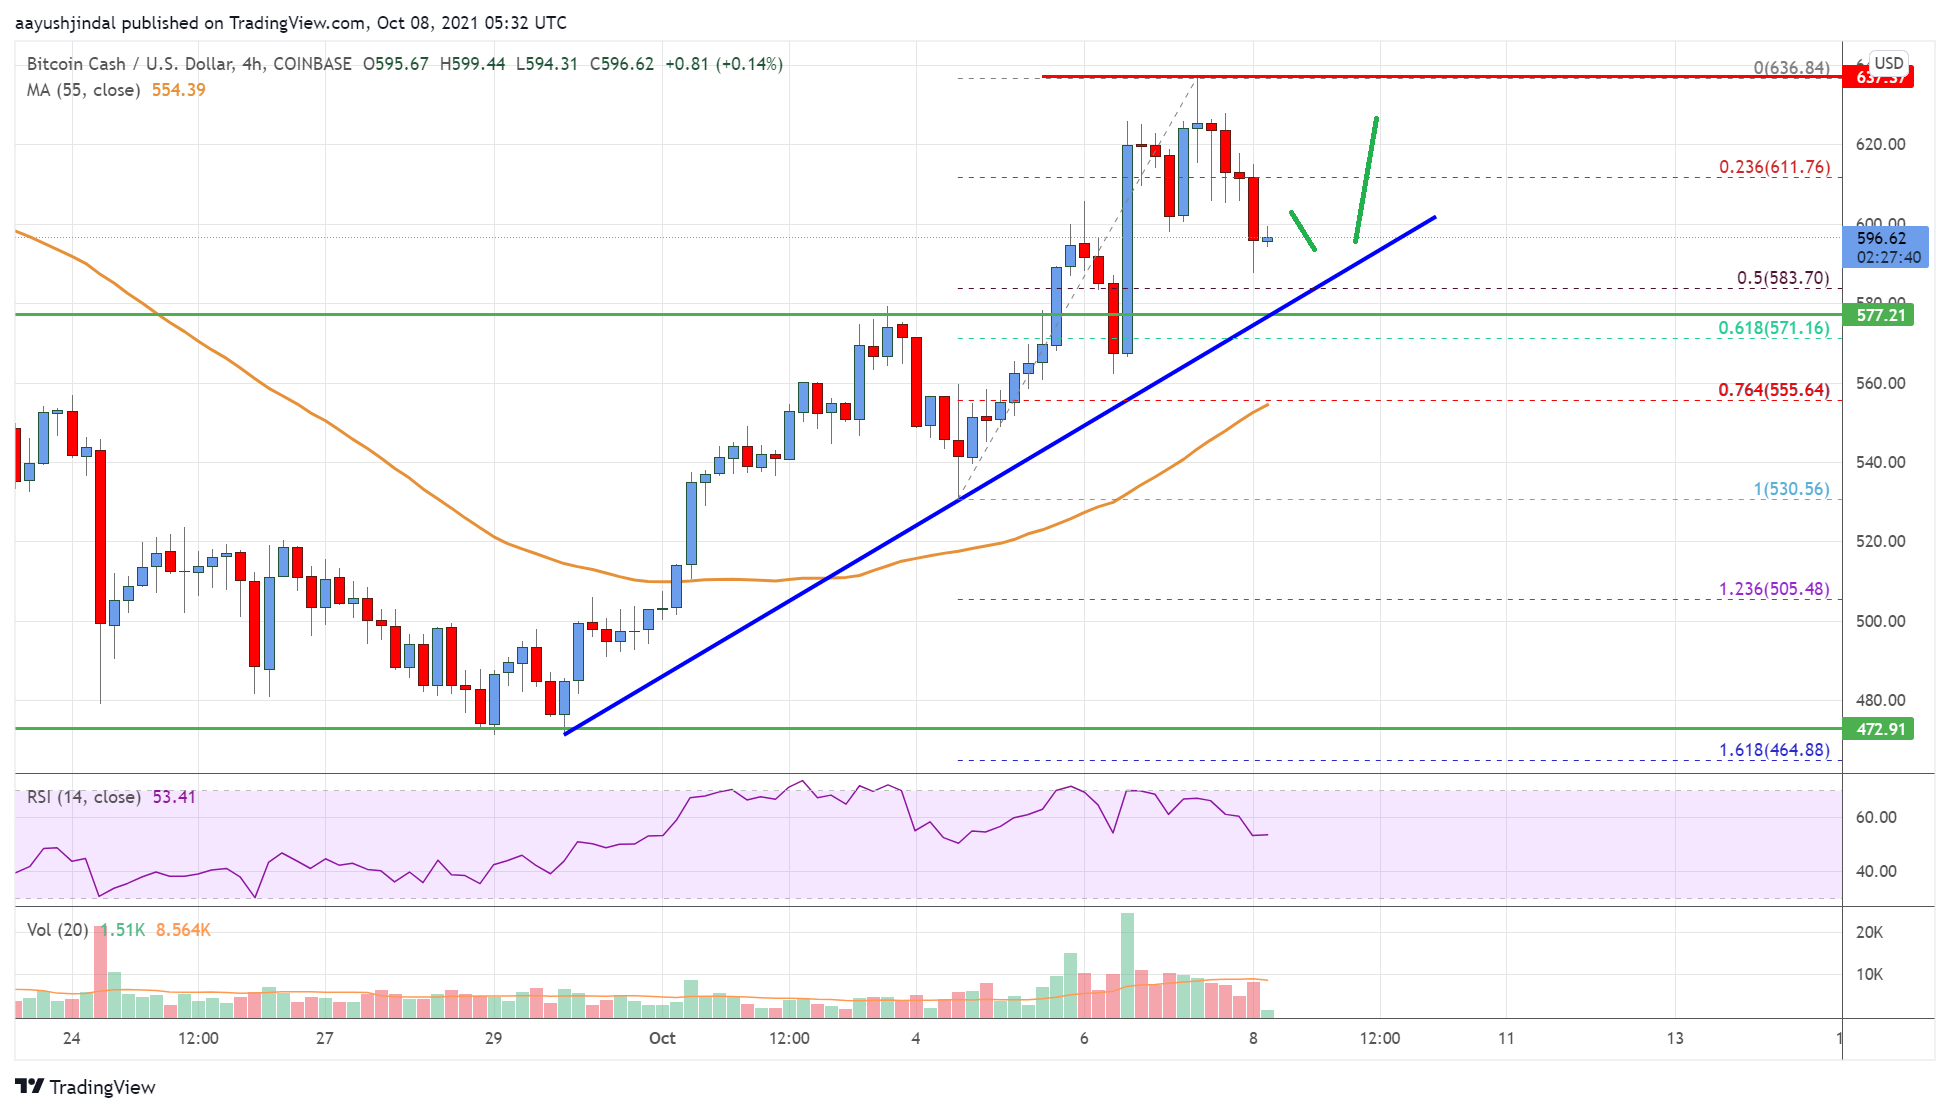
Bitcoin cash price started a major increase from the $470 zone. BCH broke the $550 resistance level and the 55 simple moving average (4-hours).
The price settled above the $550 level and surpassed the $600 level. A high was formed near $636 and it is now correcting gains. The price declined below the $610 level. It declined below the 23.6% Fib retracement level of the upward move from the $530 swing low to $638 high.
On the downside, an initial support is near the $580 level. There is also a key bullish trend line forming with support near $580 on the 4-hours chart of the BCH/USD pair.
The trend line is close to the 50% Fib retracement level of the upward move from the $530 swing low to $638 high. A downside break below the $580 support zone could open the doors for a fresh decline. The next major support is near the $550 level, below which the bears might aim a test of $500.
An immediate resistance is near the $620 level. The next major resistance could be $640. The main breakout zone is near the $650 level. A clear break above $640 and $650 might trigger a sharp upward move.

Looking at the chart, bitcoin cash price is now trading above the $580 zone and the 55 simple moving average (4-hours). Overall, the price could continue to rise towards the main $640 and $650 resistance levels in the near term.
Technical indicators
4 hours MACD – The MACD for BCH/USD is slowly gaining pace in the bullish zone.
4 hours RSI (Relative Strength Index) – The RSI for BCH/USD is now above the 50 level.
Key Support Levels – $580 and $550.
Key Resistance Levels – $640 and $650.


Leave a Reply
You must be logged in to post a comment.