
- ADA price rallied recently above the $0.0400 and $0.0420 resistance levels against the US Dollar.
- The price is currently consolidating above the key $0.0420 support areas.
- There is a short term rising channel forming with support near $0.0425 on the 4-hours chart (data feed via Kraken).
- The price is likely to find a strong support near the $0.0420 and $0.0415 levels.
Cardano price is trading in an uptrend against the US Dollar and bitcoin. ADA price correct lower in the near term, but it remains well supported above $0.0400.
Cardano Price Analysis
After tagging the $0.0350 support area, cardano price started a strong upward move against the US Dollar. ADA/USD climbed higher and broke many resistances near the $0.0380 and $0.0400 levels.
Moreover, there was a close above the $0.0400 level and the 55 simple moving average (4-hours). During the rise, there was a break above a crucial bearish trend line with resistance near $0.0390 on the 4-hours chart.
Finally, the price surged above the $0.0420 resistance and traded to a new monthly high near the $0.0448 level. Recently, the price started consolidating gains and corrected below the $0.0435 level.
Additionally, there was a break below the 23.6% Fibonacci retracement level of the recent rally from the $0.0393 low to $0.0448 high. At the outset, there is a short term rising channel forming with support near $0.0425 on the same chart.
The main support on the downside is near the $0.0420 level. It coincides with the previous resistance and the 50% Fibonacci retracement level of the recent rally from the $0.0393 low to $0.0448 high.
If there is a downside break below $0.0420, the price could test the $0.0415 support. Any further losses might lead cardano price towards the $0.0400 support and the 55 simple moving average (4-hours).
On the upside, an initial resistance is near the $0.0440 and $0.0450 levels. If there is a clear break above the $0.0450 resistance, the price could start anther rise towards the $0.0500 resistance. An intermediate resistance is near the $0.0480 and $0.0482 levels.
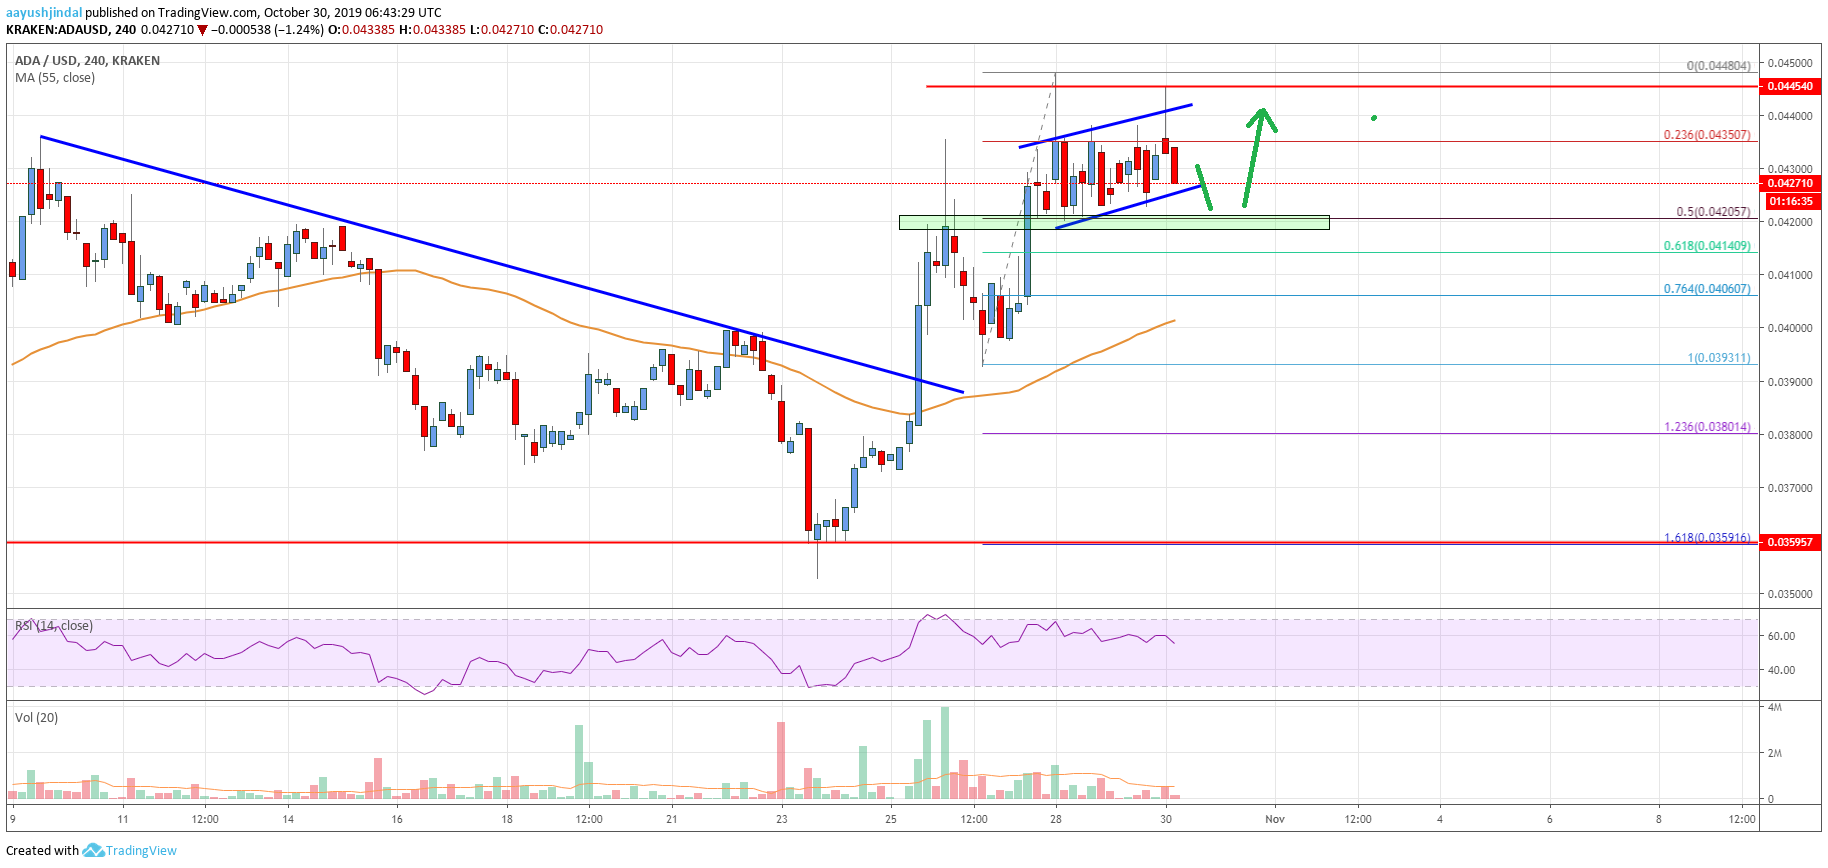
The chart indicates that ADA price is clearly trading in a solid uptrend above the $0.0420 and $0.0415 support levels. Having said that, there could be a downside correction below the $0.0420 support. The key support is near the $0.0400 level, below which the price may perhaps move back into a bearish zone.
Technical Indicators
4 hours MACD – The MACD for ADA/USD is slowly losing momentum in the bullish zone.
4 hours RSI – The RSI for ADA/USD is currently correcting lower and is approaching towards the 50 level.
Key Support Levels – $0.0420 and $0.0400.
Key Resistance Levels – $0.0440 and $0.0450.


Leave a Reply
You must be logged in to post a comment.