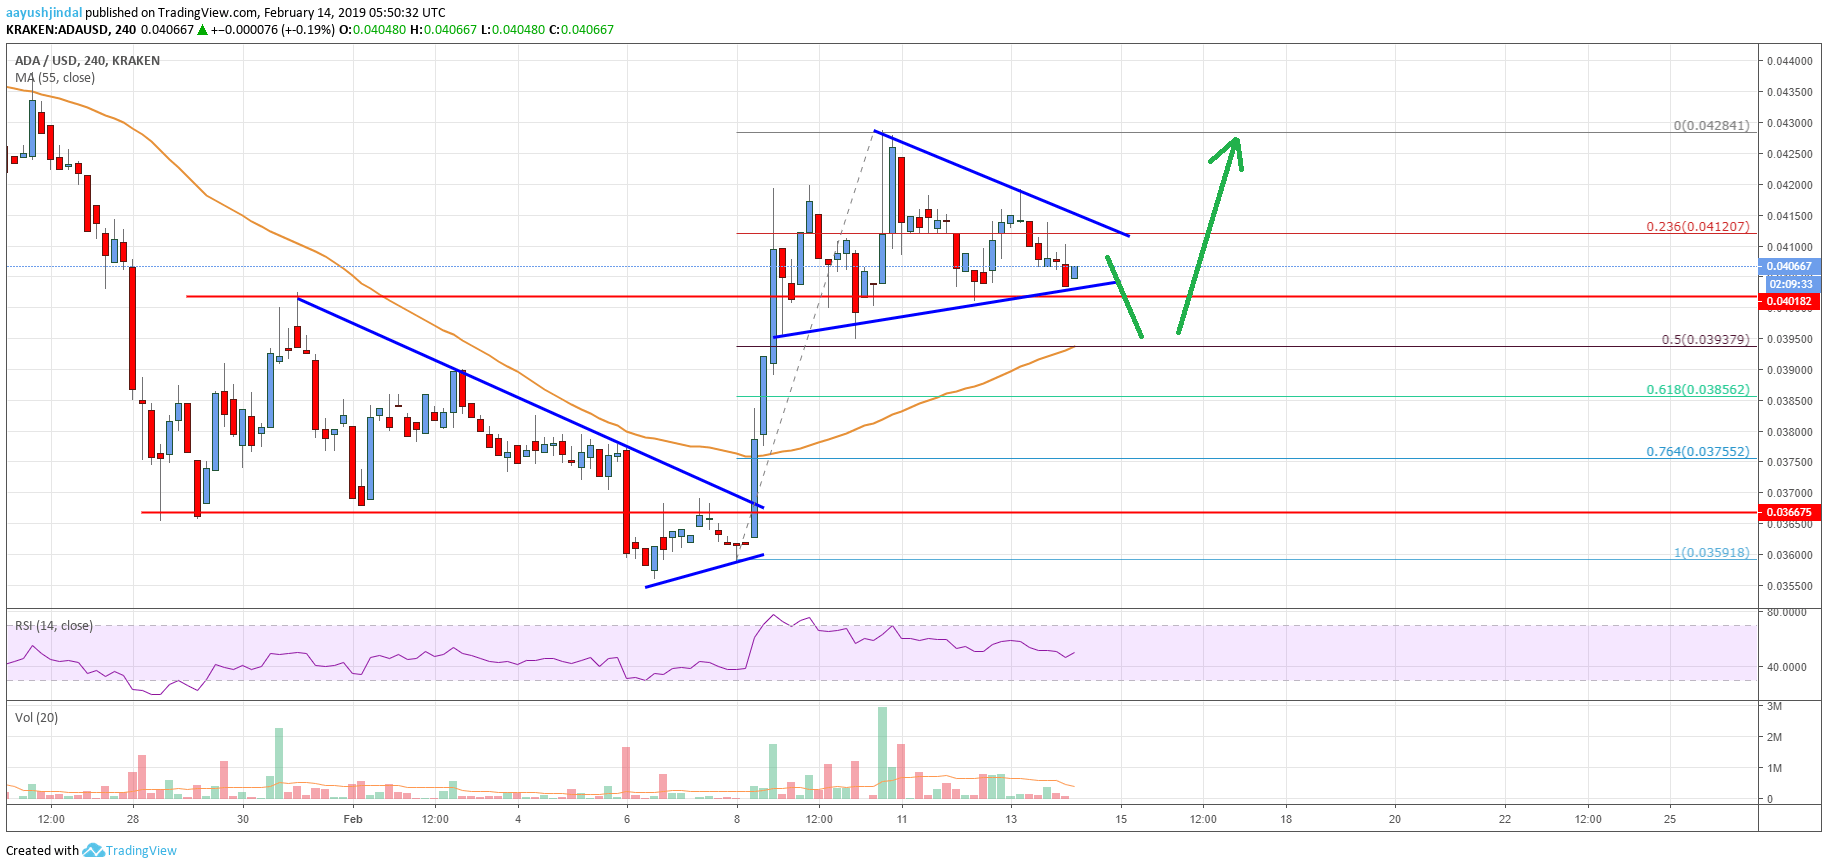
- ADA price rallied recently and broke the $0.0380 and $0.0400 resistance levels against the US Dollar.
- There was a break above a crucial bearish trend line with resistance at $0.0370 on the 4-hours chart (data feed via Kraken).
- A contracting triangle is formed with resistance at $0.0412 and support near $0.0400 on the same chart.
- The price could correct lower a few points, but it is likely to find support near the $0.0392 zone.
Cardano price gained bullish momentum recently against the US Dollar and Bitcoin. ADA is trading nicely above the $0.0400 and $0.0392 support levels, with chances of more gains.
Cardano Price Analysis
After consolidating above the $0.0365 support, cardano price declined towards $0.0355 against the US Dollar. The ADA/USD pair found a strong buying interest above the $0.0355 level and later bounced back. The price gained traction and rallied above the $0.0365 and $0.0380 resistance levels. There was a break above a crucial bearish trend line with resistance at $0.0370 on the 4-hours chart. It opened the doors for more gains and the price settled above $0.0380 plus the 55 simple moving average (4-hours). The upward move was strong as the price climbed above the $0.0400 and $0.0420 resistance levels.
A new monthly high was formed at $0.0428 and later the price corrected lower. It declined below the $0.0420 and $0.0415 support levels. Sellers pushed the price below the 23.6% Fibonacci retracement level of the recent wave from the $0.0359 low to $0.0428 high. However, the $0.0400 support area is currently acting as a support. More importantly, there is a contracting triangle is formed with resistance at $0.0412 on the same chart. If there is a downside break below the $0.0400 support, the price could test the $0.0392 support. The 50% Fibonacci retracement level of the recent wave from the $0.0359 low to $0.0428 high is also near $0.0393. Finally, the 55 simple moving average (4-hours) is positioned above $0.0392 to act as strong support.

The chart indicates that ADA price remains supported above the $0.0400 and $0.0392 levels. Should cardano price decline below the $0.0392 support, there could be a reversal towards $0.0380. Conversely, the price might accelerate gains once buyers clear the $0.0412 and $0.0415 resistance levels. The next key resistances on the upside are at $0.0425 and $0.0440. The overall price structure is positive, with chances of more gains as long as the price is above $0.0392.
Technical Indicators
4 hours MACD – The MACD for ADA/USD is slowly reducing its bullish slope.
4 hours RSI – The RSI for ADA/USD is back above the 50 level, with a bullish angle.
Key Support Level – $0.0356
Key Resistance Level – $0.0385


Leave a Reply
You must be logged in to post a comment.