- Litecoin formed a base above $45 before starting an upside correction against the US Dollar.
- LTC price is now trading below $55 and the 55 simple moving average (4-hours).
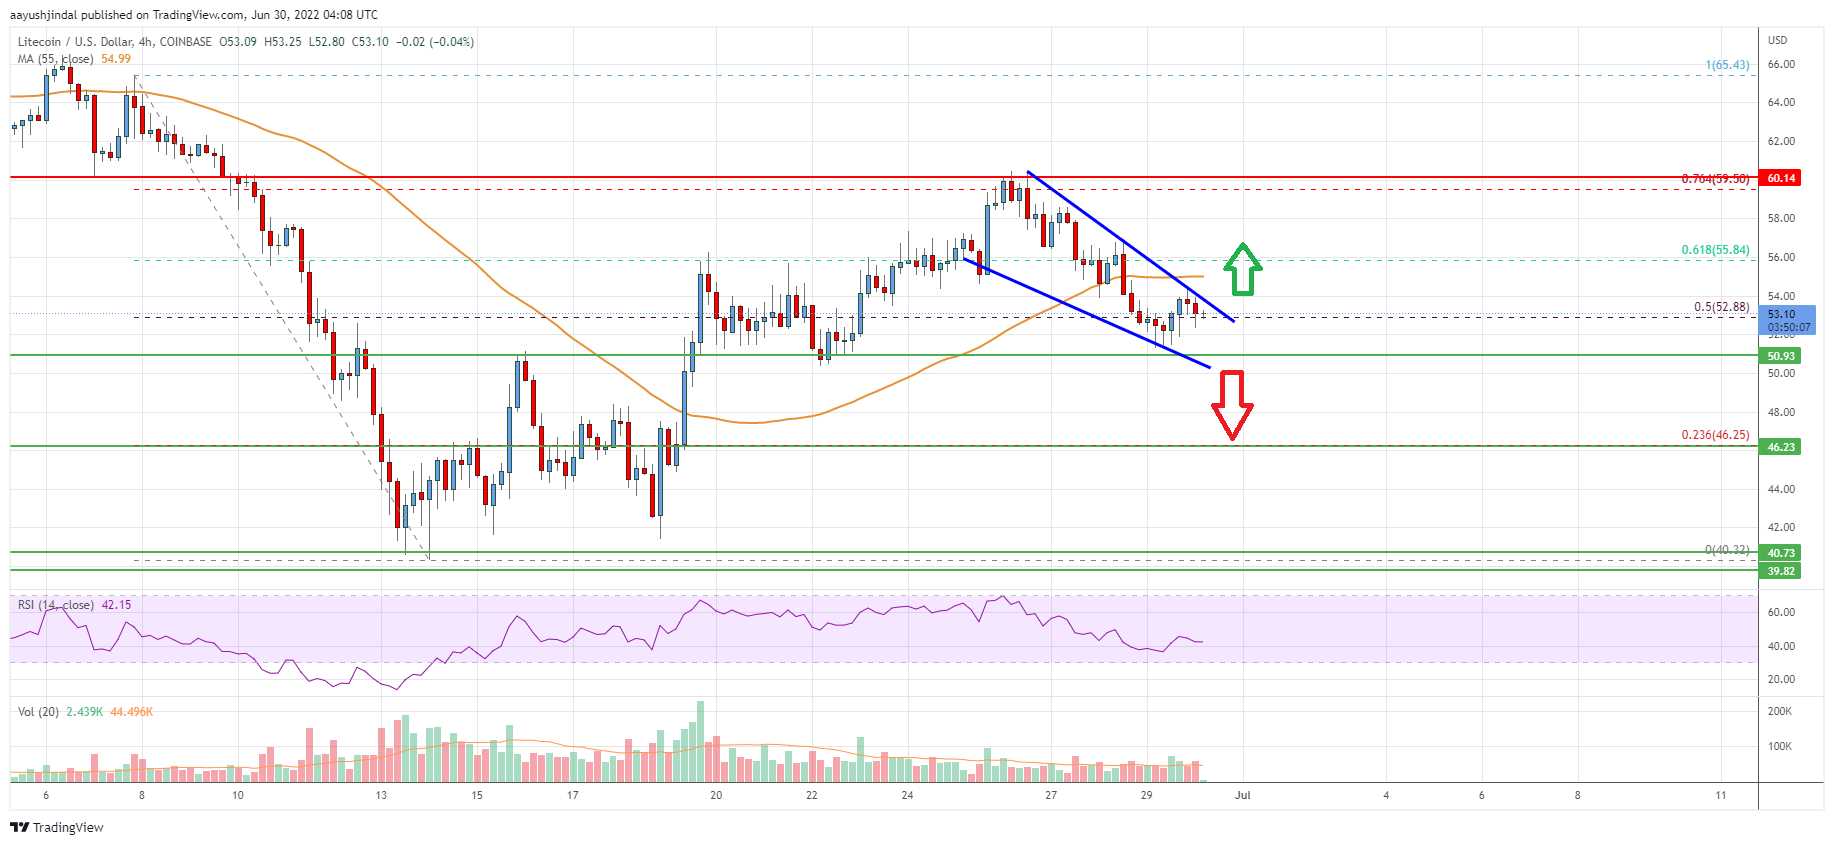
- There is a key breakout pattern forming with resistance near $54.00 on the 4-hours chart of the LTC/USD pair (data feed from Coinbase).
- The pair could gain bullish momentum if it clears the $54 resistance zone.
Litecoin price is recovering higher from $45 against the US Dollar, similar to bitcoin. LTC price could continue to move up if it clears the $54 resistance.
Litecoin Price Analysis
In the past few days, there was a minor decline in bitcoin, ethereum, ripple, and litecoin against the US Dollar. Earlier, LTC formed a base above the $45 level and started an upside correction.
There was a steady upward move above the $50 and $55 resistance levels. The price climbed above the 50% Fib retracement level of the key decline from the $65.41 swing high to $40.32 low. The price even climbed above the $58 resistance zone.
However, the price failed to clear the key $60 resistance zone. There was a rejection near the 76.4% Fib retracement level of the key decline from the $65.41 swing high to $40.32 low.
The price is now trading below $55 and the 55 simple moving average (4-hours). There is also a key breakout pattern forming with resistance near $54.00 on the 4-hours chart of the LTC/USD pair. On the downside, an immediate support is near the $52.50 level.
The next key support is near the $50.90 level. If there is a downside break below the $50.90 support, the price could accelerate lower towards the $46.25 level in the near term.
On the upside, the price is facing resistance near the $54.50 and $55.00 levels. The next major resistance is near the $60 level. A clear move above the $60 level could pump the price above the $65 level. The next major resistance sits near the $72 level.

Looking at the chart, litecoin price is clearly trading below $55 and the 55 simple moving average (4-hours). Overall, the price could gain bullish momentum if it clears the $54 resistance zone.
Technical indicators
4 hours MACD – The MACD for LTC/USD is now gaining pace in the bearish zone.
4 hours RSI (Relative Strength Index) – The RSI for LTC/USD is now below the 50 level.
Key Support Levels – $52.50 and $50.90
Key Resistance Levels – $55 and $60.


Leave a Reply
You must be logged in to post a comment.