- Litecoin price corrected lower and tested the $71.20 and $70.80 supports against the US Dollar.
- LTC price is currently recovering, but there are many hurdles near $76.00 and $76.50.
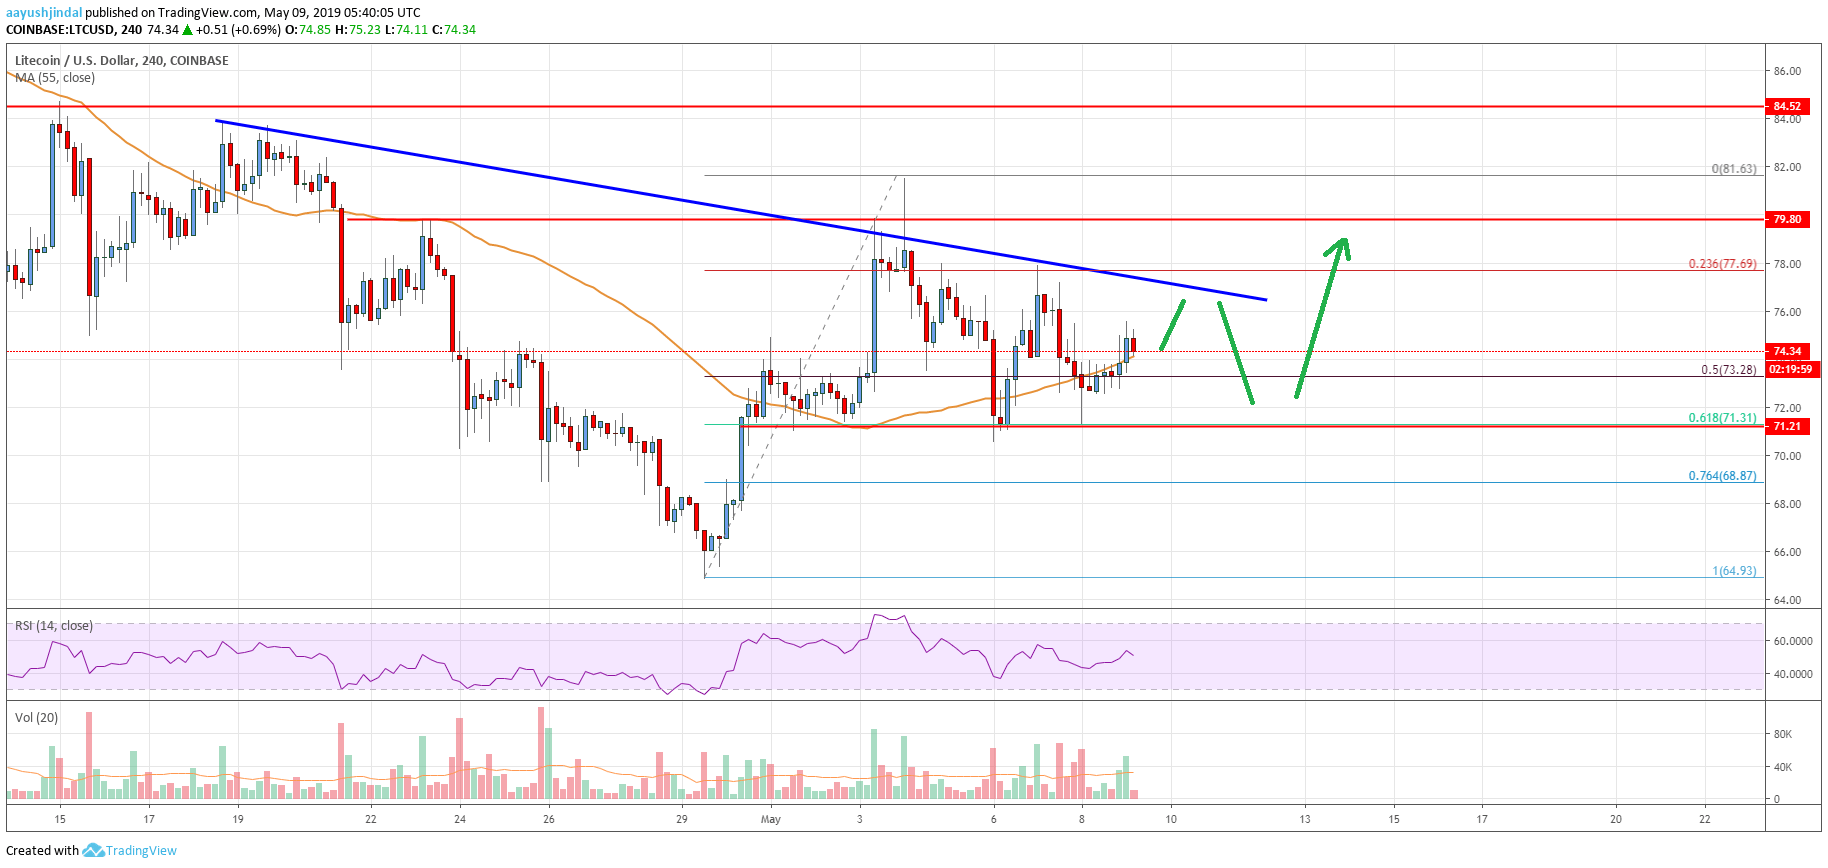
- There is a major bearish trend line formed with resistance at $76.80 on the 4-hours chart of the LTC/USD pair (data feed from Coinbase).
- The pair could trade in a range for a few sessions before it could climb above $76.50 and $76.80.
Litecoin price seems to be consolidating against the US Dollar, while bitcoin is climbing. LTC price remains well supported on the downside near $71.20 and $70.80
Litecoin Price Analysis
This past week, there was a sharp upward move in litecoin price above the $75.00 and $76.50 resistances against the US Dollar. The LTC/USD pair even broke the $80.00 resistance and 55 simple moving average (4-hours). As a result, a new monthly high was formed at $81.63 and later the price corrected lower sharply. It broke the $76.50 support level, and the 50% Fib retracement level of the key upside from the $64.93 swing low to $81.63 high. There was even a spike below the $72.00 level and the 55 simple moving average (4-hours).
However, the $71.20 and $70.80 levels acted as strong supports. Besides, the 61.8% Fib retracement level of the key upside from the $64.93 swing low to $81.63 high acted as a support. The price tested the $71.20 support on a few occasions and it recently climbed higher. Bitcoin price recently climbed to a new 2019 high, pushing litecoin above $74.00 and the 55 simple moving average (4-hours).
On the upside, there are many resistances near the $76.00, $76.50 and $76.80 levels. There is also a major bearish trend line formed with resistance at $76.80 on the 4-hours chart of the LTC/USD pair. Therefore, it won’t be easy for the bulls to clear the $76.50 and $76.80 resistances in one attempt. Above the $76.80 and $77.00 levels, the price is likely to trade towards $80.00, $81.50 or even $84.00.

Looking at the chart, litecoin price is clearly trading above a strong support area near $61.20. Therefore, dips remain attractive to the bulls near the $62.00 and $61.20 levels. As long as the price is above $61.20 and $60.80, it could break the $76.80 resistance. If not, there is a risk of a sharp decline below the $70.00 and $68.00 support levels.
Technical indicators
4 hours MACD – The MACD for LTC/USD is slowly gaining pace in the bullish zone, but the momentum is not convincing.
4 hours RSI (Relative Strength Index) – The RSI for LTC/USD is currently testing the 50 level, with a bearish angle.
Key Support Levels – $72.00 and $71.20.
Key Resistance Levels – $76.80 and $80.00.


Leave a Reply
You must be logged in to post a comment.