- EOS price declined this week after tagging the $5.500 resistance area against the US Dollar.
- The price tested the $4.875 level and it is currently trading in a range above $5.000.
- There is a crucial breakout pattern forming with resistance near $5.325 on the 4-hours chart of the EOS/USD pair (data feed from Binance).
- The pair could start a strong upward move if it clears the $5.325 and $5.550 resistance levels.
EOS price is currently trading in a range against the US Dollar, but declining vs bitcoin. The price could climb higher once the bulls gain momentum above the $5.325 and $5.550 resistances.
EOS Price Analysis
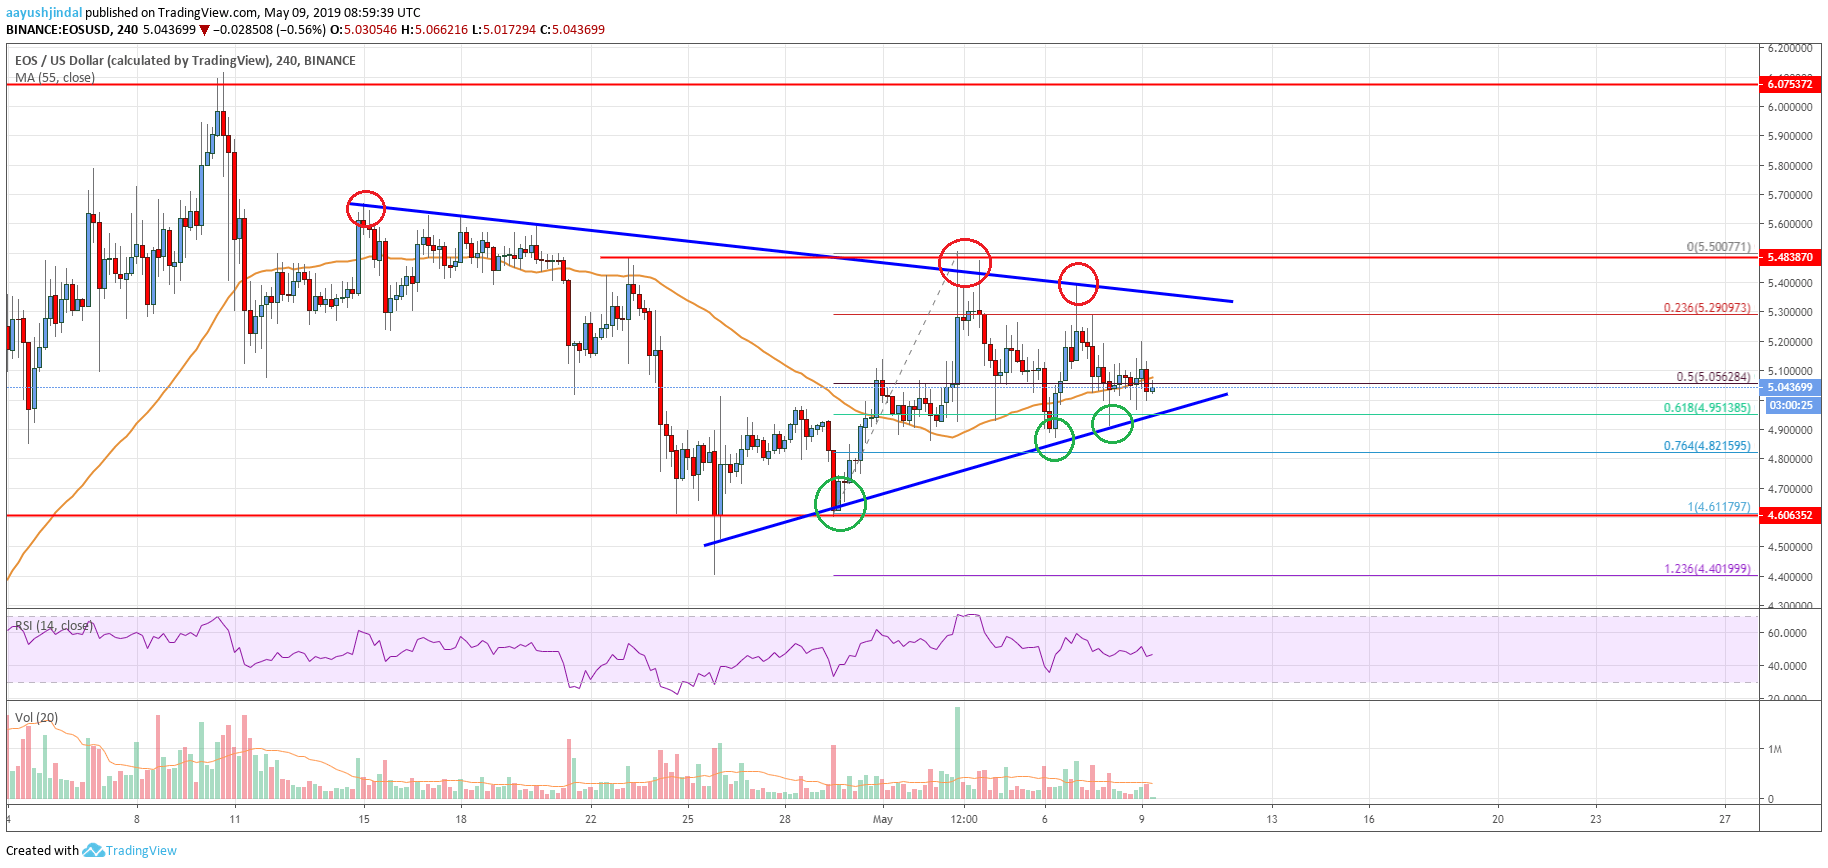
Recently, there was a sharp rise in bitcoin, but altcoins such as Ethereum, ripple, litecoin and EOS struggled against the US Dollar. Earlier, EOS price tagged the $5.550 resistance level, where it faced a strong selling interest. As a result, there was a downside correction below the $5.300 and $5.100 support levels. The price even cleared the 50% Fib retracement level of the last wave from the $4.611 low to $5.550 high. Finally, there was a spike below the $5.000 support and the 55 simple moving average (4-hours).
The price traded below the 61.8% Fib retracement level of the last wave from the $4.611 low to $5.550 high. It tested the $4.875 level and recently rebounded above $4.900 and $4.945. However, it seems like the price is struggling to settle above the $5.000 level and the 55 simple moving average (4-hours). On the upside, there are many resistances near the $5.050 and $5.080 levels. Besides, there is a crucial breakout pattern forming with resistance near $5.325 on the 4-hours chart of the EOS/USD pair.
Therefore, the pair could continue to trade in a range before the next move either above $5.325 or below $4.90. The triangle support is near $4.920, below which there is a risk of a sharp drop towards $4.800 or even $4.750. The main support is near the last swing low at $4.611, where the bulls may appear. Conversely, an upside break above the $5.080 and $5.125 levels might increase chances of a bullish break above $5.325.

Looking at the chart, EOS price is clearly consolidating near $5.000 and preparing for the next break. As long as bitcoin price keeps rising, there are chances that EOS price could climb above $5.050 and $5.080 in the near term. The next key resistances are near $5.250 and $5.325.
Technical indicators
Hourly MACD – The MACD for EOS/USD is still in the bearish zone.
Hourly RSI (Relative Strength Index) – The RSI is currently just below the 50 level, with a flat structure.
Major Support Levels – $4.900 and $4.750.
Major Resistance Levels – $5.080 and $5.250.


Leave a Reply
You must be logged in to post a comment.