- Litecoin price is declining and it recently broke the $52.50 support area against the US Dollar.
- LTC price is trading near $45.00 and it remains at a risk of more losses.
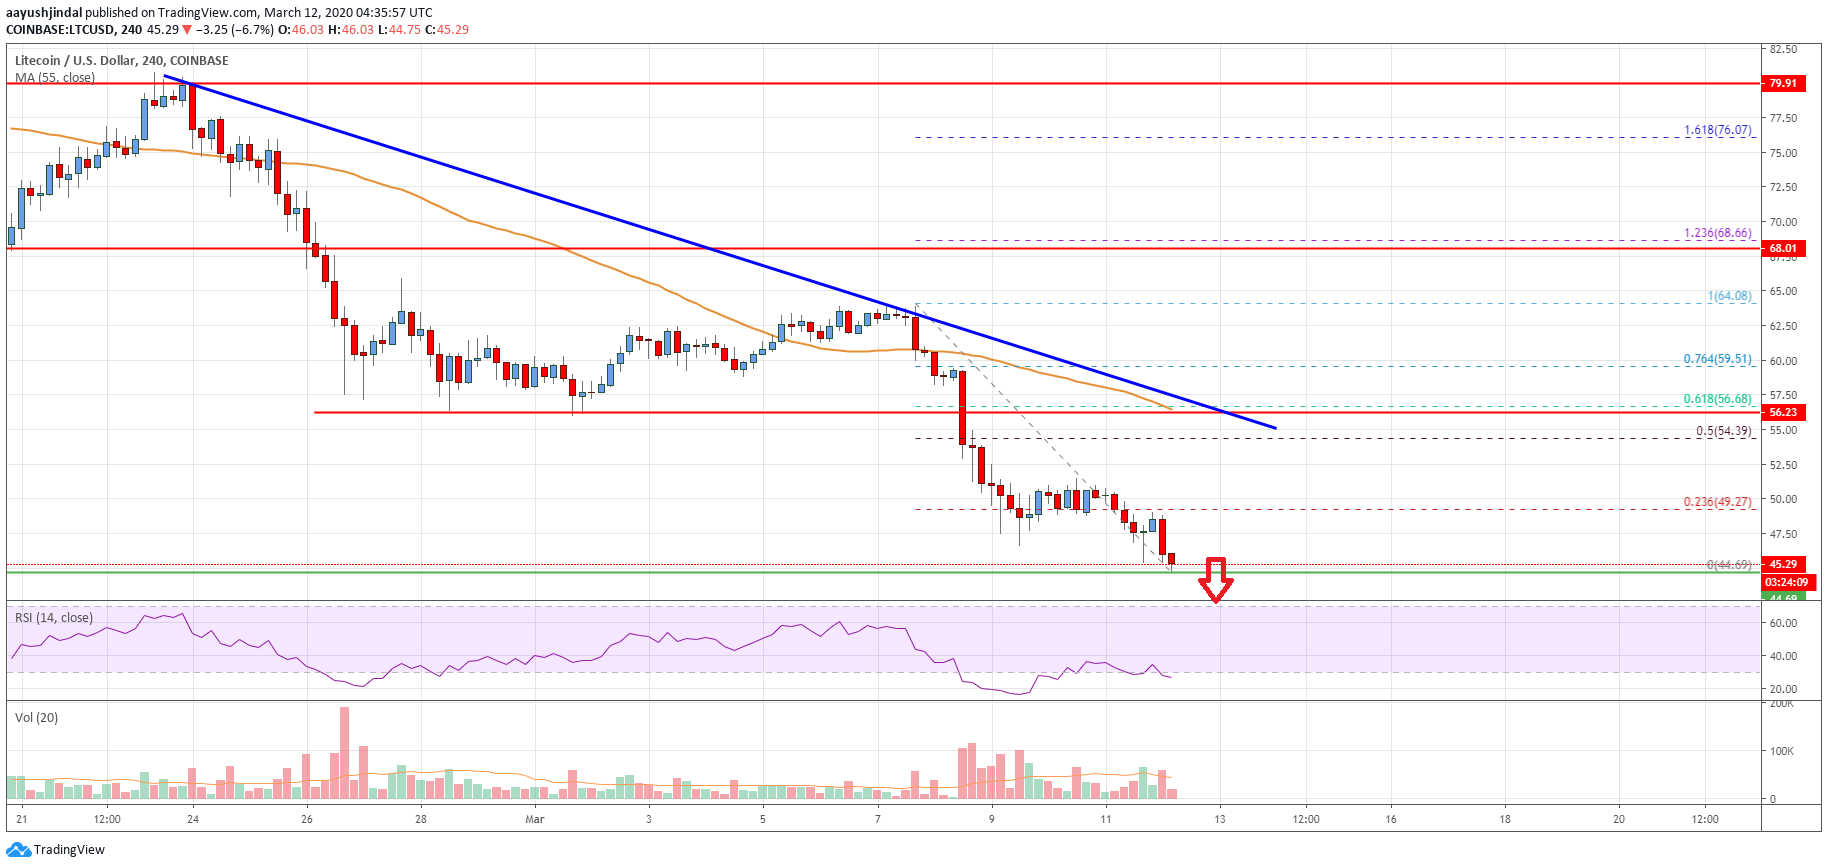
- There is a key bearish trend line forming with resistance near $54.60 on the 4-hours chart of the LTC/USD pair (data feed from Coinbase).
- The pair could extend its decline towards the main $40.00 support level in the near term.
Litecoin price is trading in a bearish zone below $50.00 against the US Dollar, similar to bitcoin. LTC price could continue to move down unless it rallies above $52.50 and $55.00.
Litecoin Price Analysis
In the past few days, there was a sharp decline in bitcoin, Ethereum, ripple, and litecoin against the US Dollar. LTC price followed a bearish path from well above the $60.00 support area.
The recent decline was such that the price broke the key $52.50 support and the 55 simple moving average (4-hours). Finally, there was a break below the $50.00 support and the price traded to a new monthly low of $44.69.
Litecoin price is currently trading with a bearish angle below $46.50. An initial resistance is near the $49.00 level. The 23.6% Fib retracement level of the recent decline from the $64.08 high to $44.69 low is also near the $49.00 area.
If there is an upside correction above the $50.00 level, the price could recover towards the $52.50 resistance. The main resistance is now near the $55.00 zone and the 55 simple moving average (4-hours).
More importantly, there is a key bearish trend line forming with resistance near $54.60 on the 4-hours chart of the LTC/USD pair. The 50% Fib retracement level of the recent decline from the $64.08 high to $44.69 low is also near $54.39.
Therefore, upsides are likely to remain capped in the near term towards the $52.50 and $55.00 levels. On the downside an initial support is near the $44.50 level.
If there is a bearish break below the $44.50 and $44.00 levels, there is a risk of a sharp decline towards the $40.00 support level in the near term.

Looking at the chart, litecoin price is clearly trading in a strong downtrend below $50.00 and $55.00. Unless it recovers above $55.00, the bears remain in control and they could eye a test of the $40.00 area.
Technical indicators
4 hours MACD – The MACD for LTC/USD is gaining momentum in the bearish zone.
4 hours RSI (Relative Strength Index) – The RSI for LTC/USD is now well below the 50 level.
Key Support Levels – $44.50 and $40.00.
Key Resistance Levels – $52.50 and $55.00.


Leave a Reply
You must be logged in to post a comment.