- Ripple price started a fresh decline from the $0.4950 zone against the US dollar.
- The price is now trading below $0.485 and the 55 simple moving average (4 hours).
- There is a major bearish trend line forming with resistance near $0.476 on the 4-hour chart of the XRP/USD pair (data source from Bittrex).
- The pair could extend losses if it stays below the $0.485 resistance zone.
Ripple price is struggling below $0.485 against the US Dollar, similar to Bitcoin. XRP price could decline further if it settles below the $0.455 support in the near term.
Ripple Price Analysis
This past week, Ripple price started a fresh decline from well above $0.4950 against the US Dollar. The XRP/USD pair gained bearish momentum below the $0.4850 level.
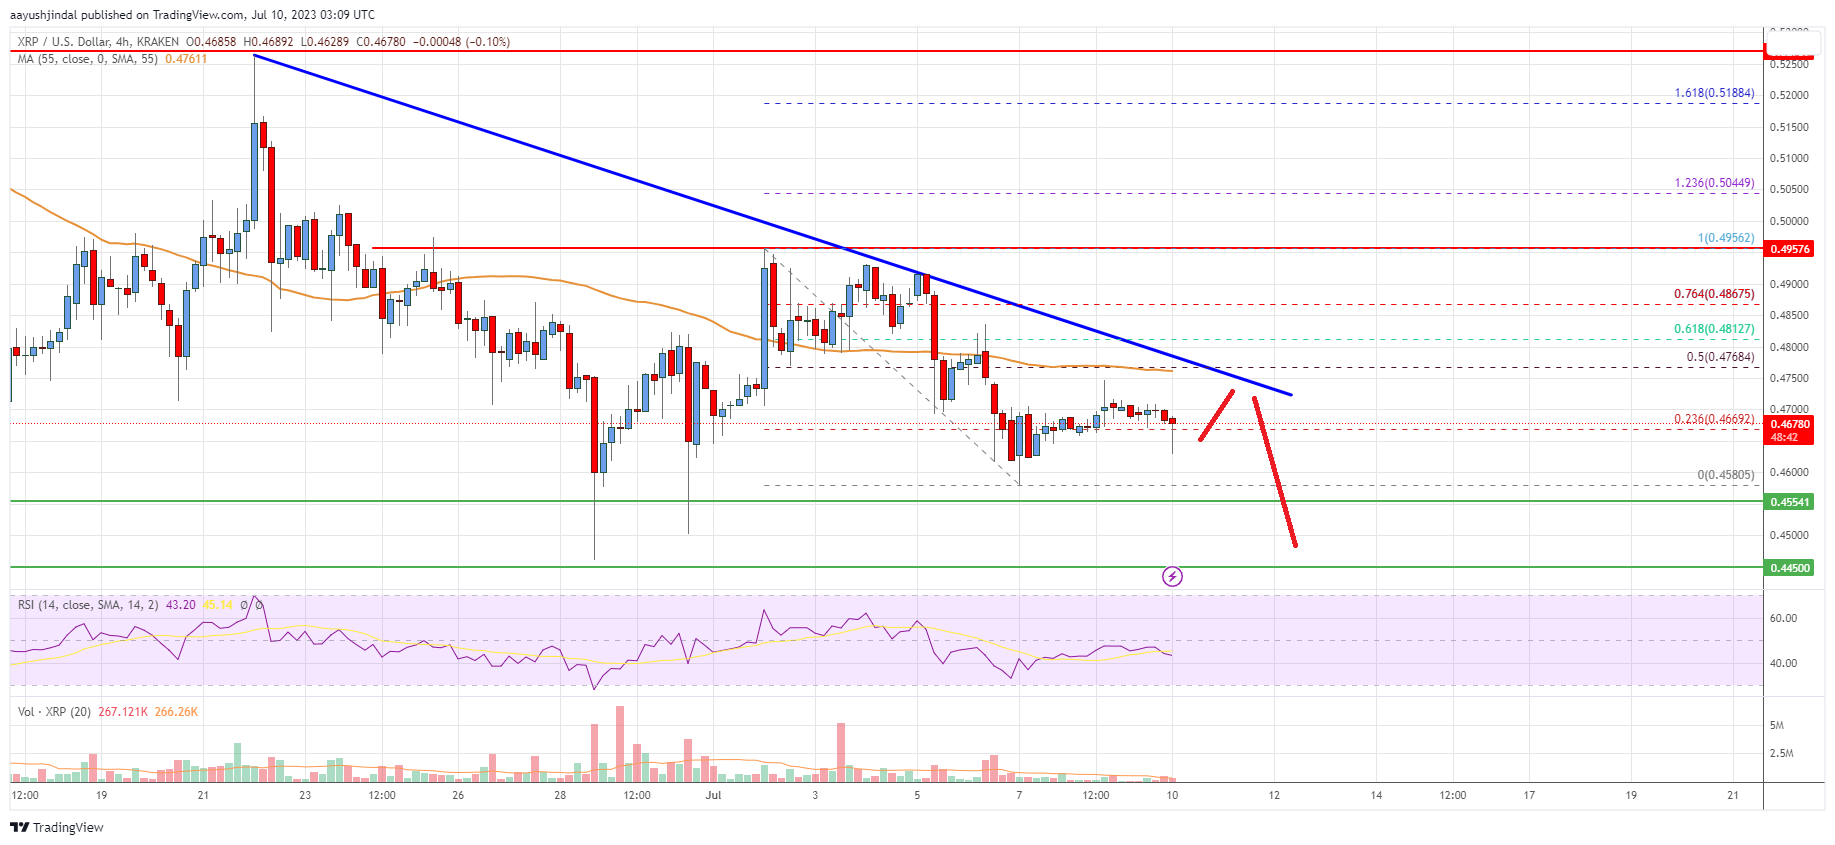
The bears were able to push the price below the $0.4800 support. It even traded below the 55 simple moving average (4 hours) and spiked below the $0.462 support. A low is formed near $0.4580 and the price is now attempting a recovery wave.
XRP is now trading below $0.485 and the 55 simple moving average (4 hours). Besides, there is a major bearish trend line forming with resistance near $0.476 on the 4-hour chart of the XRP/USD pair.
On the upside, the price is facing resistance near $0.475 and the trend line. It is close to the 50% Fib retracement level of the downward move from the $0.4956 swing high to the $0.4580 low. The next major resistance is near the $0.4860 level.
It is close to the 61.8% Fib retracement level of the downward move from the $0.4956 swing high to the $0.4580 low. A clear move above the trend line resistance and $0.4860 might start a fresh increase. In the stated case, the price could even surpass the $0.495 resistance. Any more gains might send the price toward the $0.520 resistance.
Initial support on the downside is near $0.4550. The next major support is near the $0.4450 level. Any more losses could lead the price toward the $0.420 level, below which the price might even test $0.40.
Looking at the chart, Ripple’s price is now trading below the $0.485 zone and the 55 simple moving average (4 hours). Overall, the price could extend losses if it stays below the $0.455 resistance zone.
Technical indicators
4 hours MACD – The MACD for XRP/USD is now losing momentum in the bearish zone.
4 hours RSI (Relative Strength Index) – The RSI for XRP/USD is below the 50 level.
Key Support Levels – $0.4550, $0.4450, and $0.4200.
Key Resistance Levels – $0.4760 and $0.4850.