- Ripple price is currently consolidating above the $0.3000 support area against the US dollar.
- The price is facing a strong resistance on the upside near the $0.3190 and $0.3200 levels.
- There is a key bearish trend line forming with resistance near $0.3220 on the 4-hours chart of the XRP/USD pair (data source from Bittrex).
- The price remains at a risk of more downsides unless it climbs positively above the $0.3220 resistance.
Ripple price is trading in a bearish zone below the $0.3200 pivot against the US Dollar. XRP price could decline heavily if it continues to struggle near $0.3200-0.3220.
Ripple Price Analysis
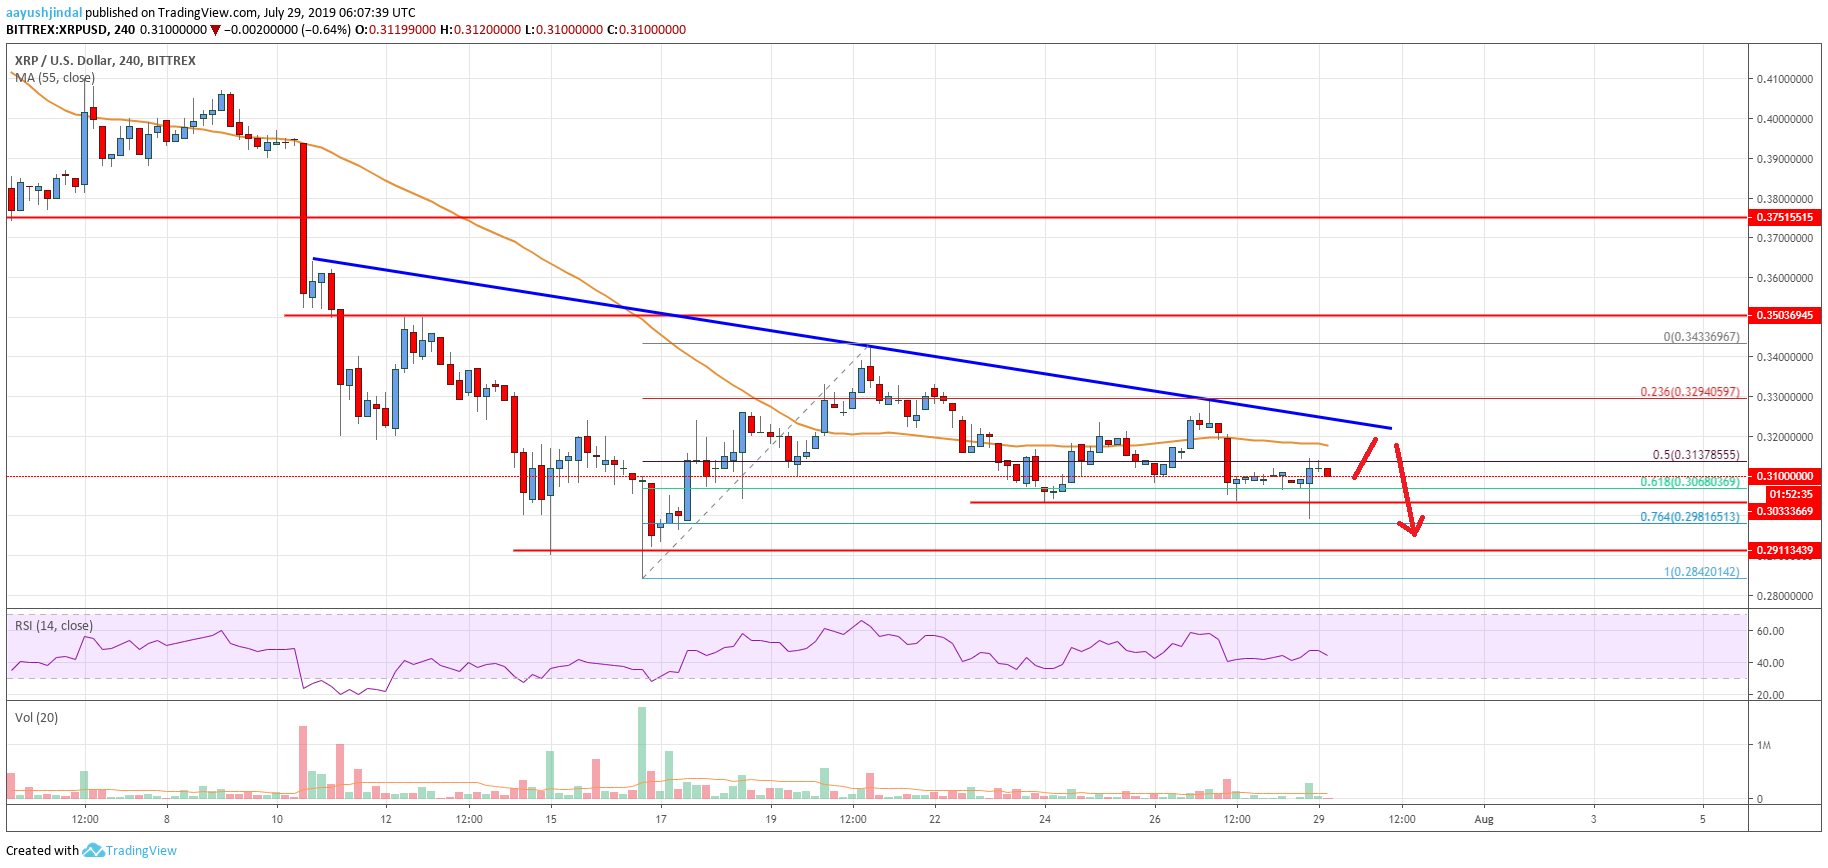
This past week, there were fresh bearish moves in bitcoin, Ethereum, bitcoin cash, ADA and ripple against the US Dollar. The XRP/USD pair topped near the $0.3290 level and later declined below the $0.3200 and $0.3150 support levels. Moreover, there was a close below the $0.3200 support and the 55 simple moving average (4-hours). There was a break below the 50% Fib retracement level of the upward move from the $0.2840 low to $0.3433 high.
However, the decline was protected by the $0.3035 support level. Besides, the price spiked towards the 76.4% Fib retracement level of the upward move from the $0.2840 low to $0.3433 high. The current price action seems choppy, with range moves above the $0.3035 support. On the upside, there are many hurdles forming near the $0.3200 level.
An immediate resistance is near the $0.3200 level and the 55 simple moving average (4-hours). More importantly, there is a key bearish trend line forming with resistance near $0.3220 on the 4-hours chart of the XRP/USD pair. If there is an upside break above the $0.3200 resistance and the bearish trend line, there could be more gains. The next key resistance is near the $0.3400 and $0.3420 levels.
Conversely, if the price fails to clear the $0.3200 and $0.3220 resistance levels, there could be a fresh decline. The main support is near the $0.3000 level. Therefore, a daily close below the $0.3000 support might spark sharp bearish moves. The next key support is near the $0.2840 level, followed by $0.2820.

Looking at the chart, ripple price is clearly facing a lot of hurdles near $0.3200. If the bulls continue to struggle below $0.3200, there are chances of a significant downward move. Besides, similar patterns were observed for bitcoin and Ethereum.
Technical indicators
4 hours MACD – The MACD for XRP/USD is currently placed in the bearish zone.
4 hours RSI (Relative Strength Index) – The RSI for XRP/USD is currently below the 50 level, with a bearish angle.
Key Support Levels – $0.3030, $0.3000 and $0.2840.
Key Resistance Levels – $0.3200 and $0.3220.


Leave a Reply
You must be logged in to post a comment.