- Stellar lumen price is struggling below the $0.135 resistance zone against the US Dollar.
- XLM price is now trading below $0.130 and the 55 simple moving average (4 hours).
- There is a key bearish trend line forming with resistance near $0.131 on the 4-hour chart (data feed via Kraken).
- The pair could start a fresh increase if it clears the $0.135 resistance.
Stellar lumen price is trading below $0.135 against the US Dollar, similar to Bitcoin. XLM price could extend losses if it trades below the $0.120 support.
Stellar Lumen Price Analysis (XLM to USD)
After a sharp decline below $0.135, Stellar Lumen price moved into a bearish zone against the US Dollar. The XLM/USD pair traded below the $0.120 level.
There was also a spike below the $0.105 support zone. A low was formed near $0.100 and the price is now attempting a recovery wave. There was a move above the $0.105 and $0.120 levels. The price climbed above the 50% Fib retracement level of the downward move from the $0.1460 swing high to the $0.1000 low.
However, the bears were active near the $0.13 zone. XLM is now trading below $0.130 and the 55 simple moving average (4 hours). There is also a key bearish trend line forming with resistance near $0.131 on the 4-hour chart.
The next key resistance is seen near the $0.135 level. It is close to the 76.4% Fib retracement level of the downward move from the $0.1460 swing high to the $0.1000 low. A clear upside break above the $0.135 zone might send the price toward $0.144.
Any more gains could lead the price toward the $0.1525 level. Initial support on the downside is near the $0.124 level. The next major support is near the $0.120 zone.
Any more losses could lead the price toward the $0.1120 level in the near term, below which the price might even retest $0.1050. The next major support is near $0.10.
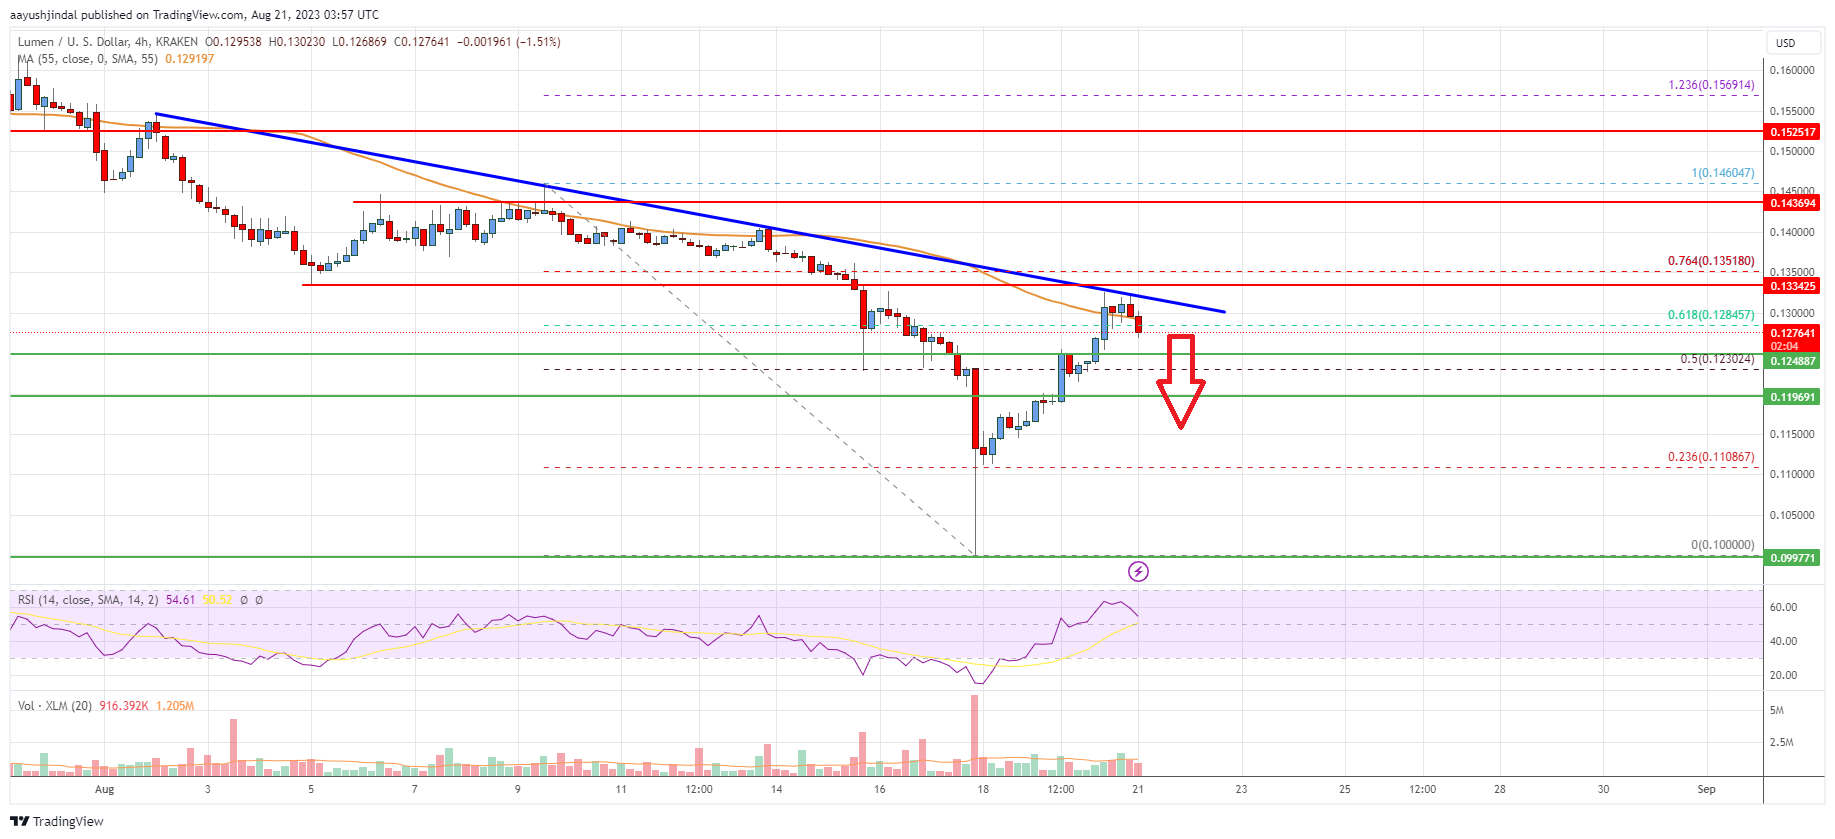
The chart indicates that XLM price is now trading below $0.135 and the 55 simple moving average (4 hours). Overall, the price could start a fresh increase if it clears the $0.135 resistance.
Technical Indicators
4 hours MACD – The MACD for XLM/USD is gaining momentum in the bearish zone.
4 hours RSI – The RSI for XLM/USD is now above the 50 level.
Key Support Levels – $0.124 and $0.120.
Key Resistance Levels – $0.131, $0.1350, and $0.145.
