- Stellar lumen price started a fresh increase above the $0.1250 resistance zone against the US Dollar.
- XLM price is now trading above $0.1250 and the 55 simple moving average (4-hours).
- There is a major bullish trend line forming with support near $0.1260 on the 4-hours chart (data feed via Kraken).
- The pair could continue to rise if it stays above the $0.1250 and $0.1220 support levels.
Stellar lumen price is trading above $0.1250 against the US Dollar, similar to bitcoin. XLM price must stay above the $0.1220 support to rise further.
Stellar Lumen Price Analysis (XLM to USD)
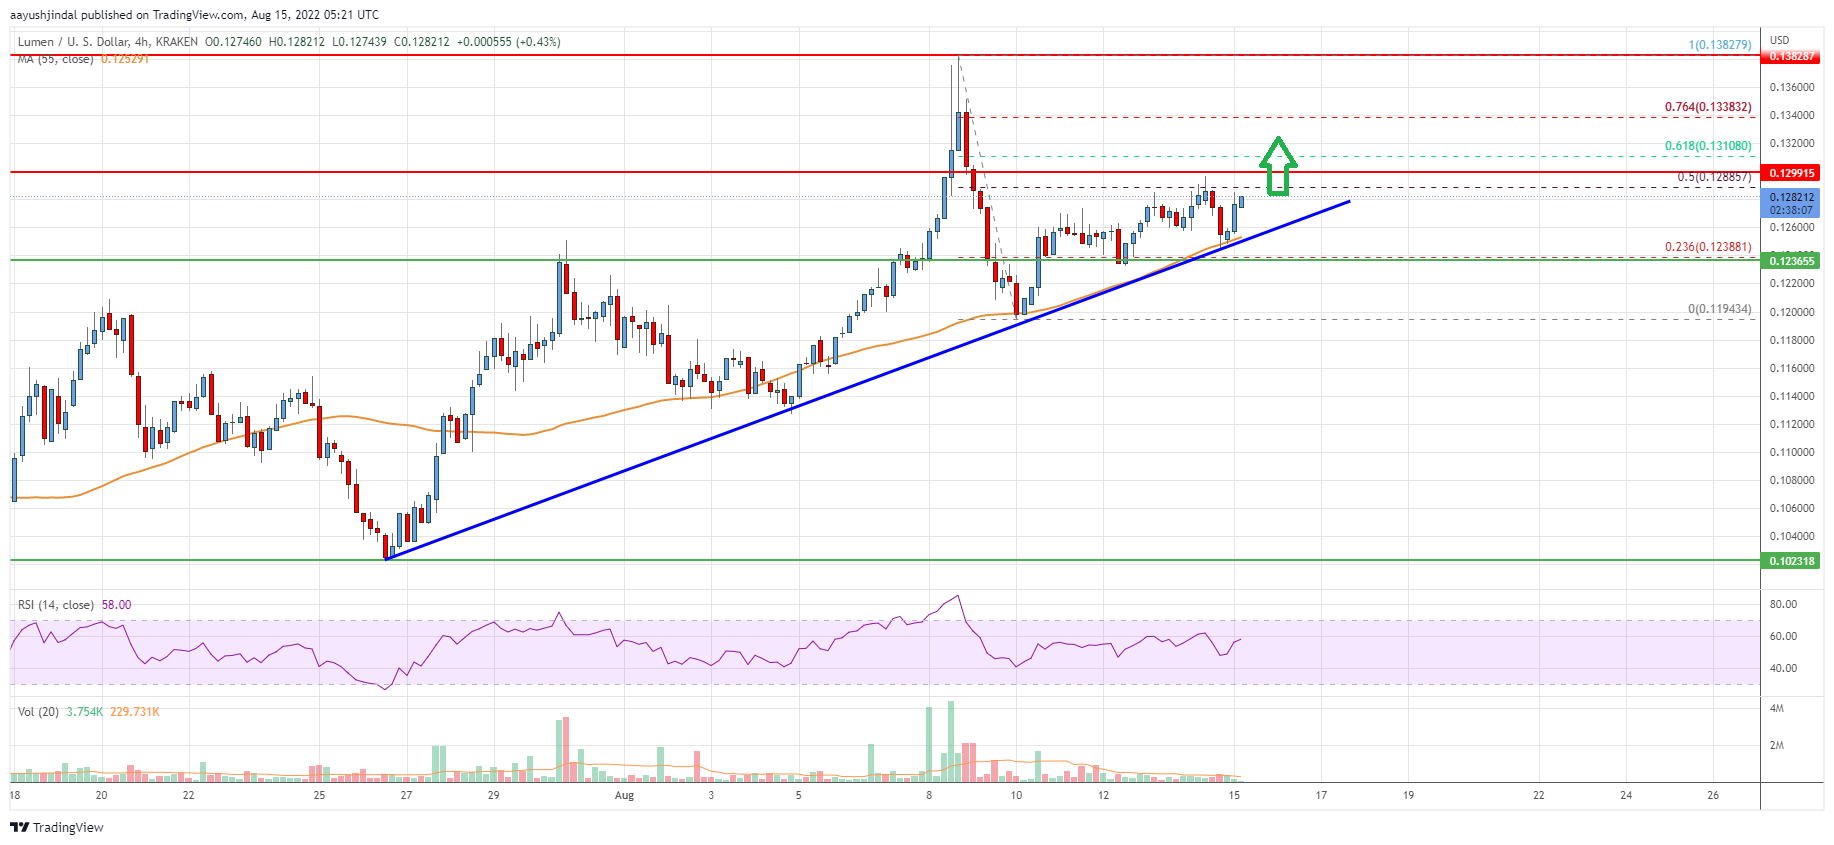
After forming a base above the $0.1180 level, stellar lumen price started a fresh increase against the US Dollar. The XLM/USD pair broke the $0.1200 resistance zone to move into a positive zone.
The price even broke the $0.1220 resistance and the 55 simple moving average (4-hours). It even cleared the $0.1250 resistance zone. It surpassed the 23.6% Fib retracement level of the downward move from the $0.1382 swing high to $0.1194 low.
XLM is also trading above $0.1250 and the 55 simple moving average (4-hours). On the upside, the price is facing resistance near the $0.1288 zone. It is near the 50% Fib retracement level of the downward move from the $0.1382 swing high to $0.1194 low.
The next major resistance is near the $0.1300 level. A clear move above the $0.1300 level might send the price towards the $0.1350 level. Any more gains could lead the price towards the $0.1420 level or even $0.1450 in the coming days.
An initial support on the downside is near the $0.1250 level. There is also a major bullish trend line forming with support near $0.1260 on the 4-hours chart. The main support is near the $0.1220 zone. Any more losses could lead the price towards the $0.1200 level in the near term, below which the price might even retest $0.1120.

The chart indicates that XLM price is now trading above $0.1250 and the 55 simple moving average (4-hours). Overall, the price could continue to rise if it stays above the $0.1250 and $0.1220 support levels.
Technical Indicators
4 hours MACD – The MACD for XLM/USD is gaining momentum in the bullish zone.
4 hours RSI – The RSI for XLM/USD is now above the 50 level.
Key Support Levels – $0.1250 and $0.1220.
Key Resistance Levels – $0.1300, $0.1350 and $0.1420.


Leave a Reply
You must be logged in to post a comment.