- Tron price formed a base above $0.0500 and started a fresh increase against the US Dollar.
- TRX price is now trading well above $0.0600 and the 55 simple moving average (4-hours).
- There was a break above a major bearish trend line with resistance near $0.0650 on the 4-hours chart (data feed via Bitfinex).
- The pair is correcting gains, but dips are likely to be limited below $0.0640 and $0.0620.
TRON price is now showing positive signs above $0.0600 against the US Dollar, similar to bitcoin. TRX price must stay above $0.0620 to continue higher in the near term.
Tron Price Analysis
After forming a base above the $0.0500 zone, tron price started a fresh increase against the US Dollar. TRX price broke many hurdles near the $0.0600 zone to move into a positive zone.
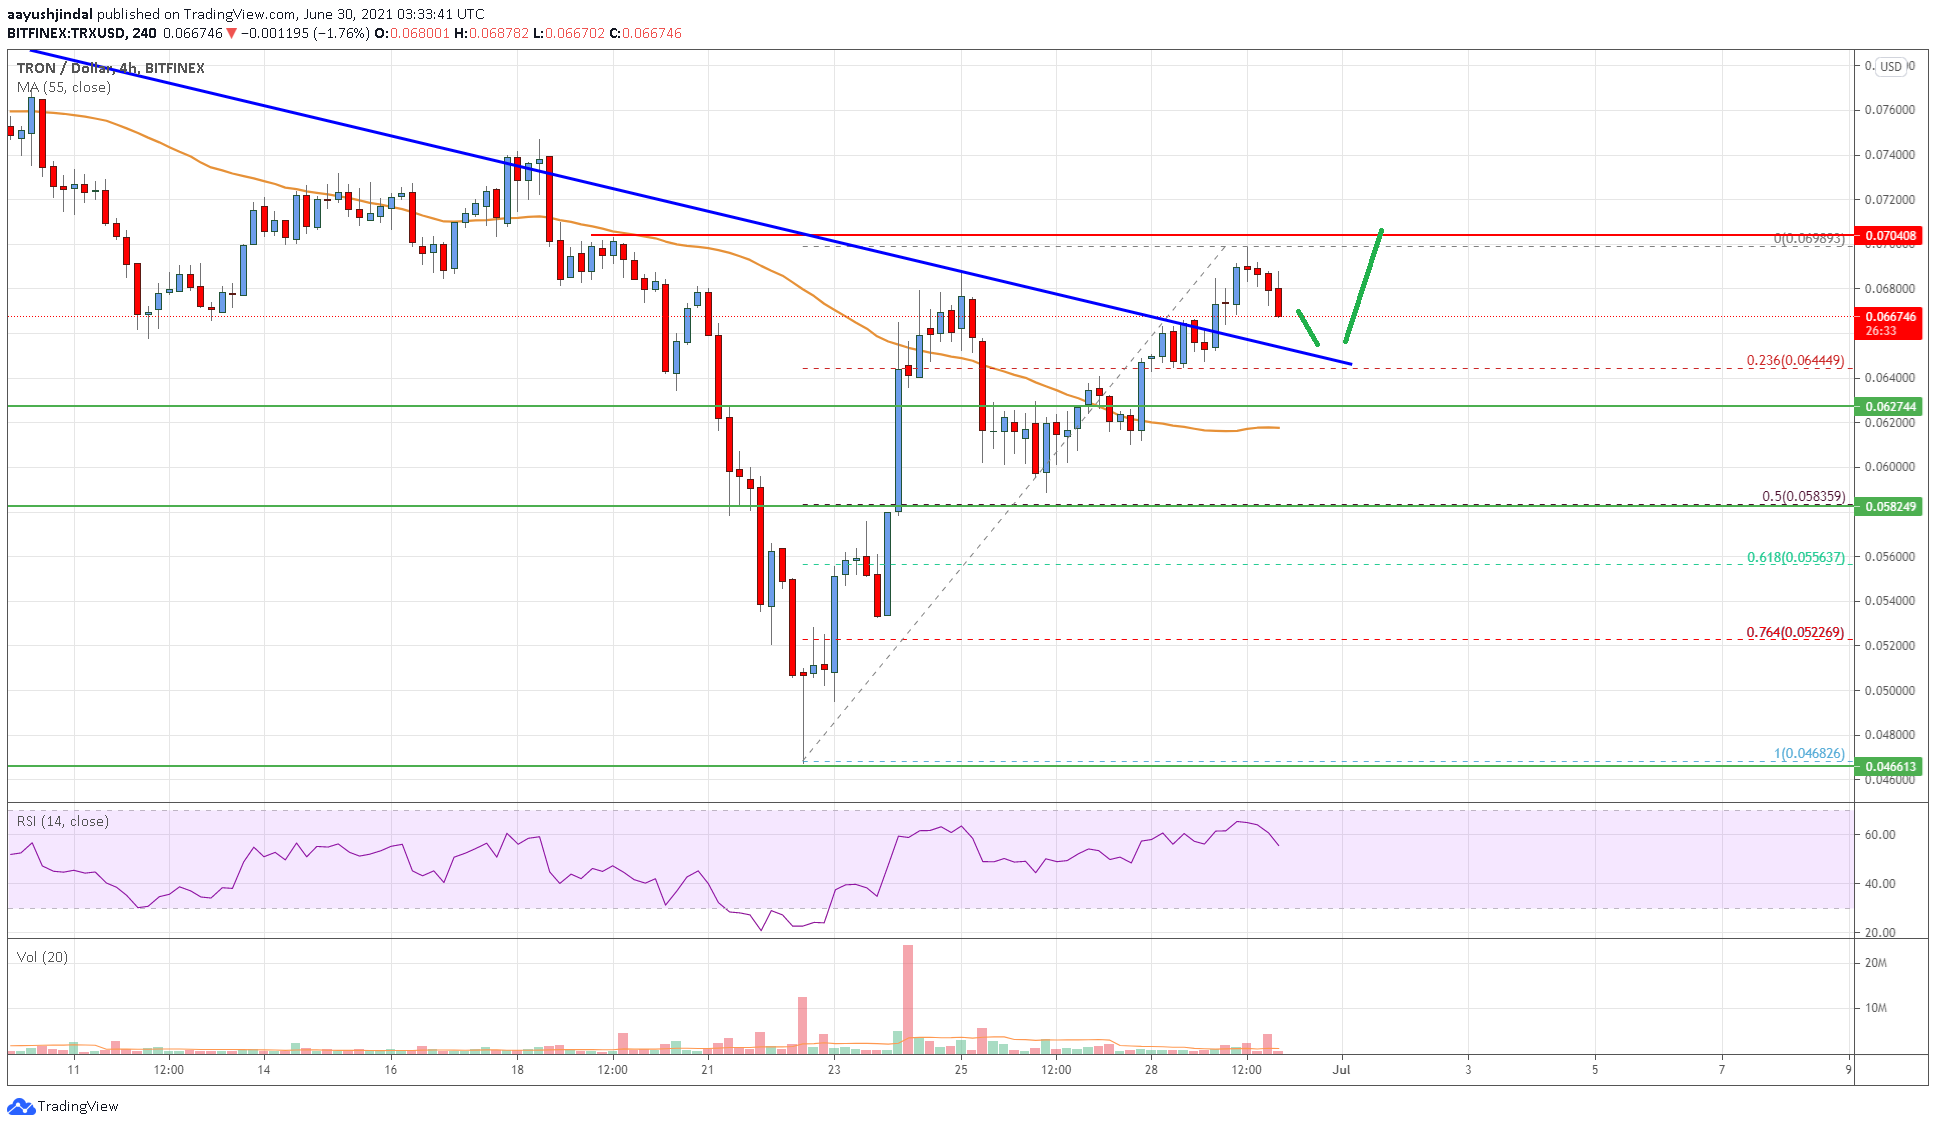
There was a clear break above the 61.8% Fib retracement level of the recent drop from the $0.0750 swing high to $0.0466 low. There was also a break above a major bearish trend line with resistance near $0.0650 on the 4-hours chart.
The pair traded as high as $0.0698 and it is now correcting gains. It is still trading well above $0.0600 and the 55 simple moving average (4-hours).
An immediate support is near the broken trend line at $0.0650. The first key support is near the $0.0644 level. It is near the 23.6% Fib retracement level of the upward move from the $0.0468 swing low to $0.0698 high. The next major support is near the $0.0620 level.
Any more losses might call for a drop towards the $0.0580 zone. It is near the 50% Fib retracement level of the upward move from the $0.0468 swing low to $0.0698 high. On the upside, the price is facing resistance near $0.0690 and $0.0700. A clear upside break above $0.0690 and $0.0700 could open the doors for a sharp increase. The next major resistance is near $0.0750, above which the price could revisit $0.0800.

The chart indicates that TRX price is now trading well above the $0.0600 zone and the 55 simple moving average (4-hours). Overall, the price is correcting gains, but dips are likely to be limited below $0.0640 and $0.0620.
Technical Indicators
4 hours MACD – The MACD for TRX/USD is slowly losing momentum in the bullish zone.
4 hours RSI – The RSI for TRX/USD is now well above the 50 level.
Key Support Levels – $0.0644 and $0.0620.
Key Resistance Levels – $0.0690, $0.0700 and $0.0800.


Leave a Reply
You must be logged in to post a comment.