
- Tron price is currently consolidating below the key $0.0184 resistance support against the US Dollar.
- TRX price seems to be forming a strong support near the $0.0165 level.
- There is a connecting bearish trend line forming with resistance near $0.0180 on the 4-hours chart (data feed via Bitfinex).
- The price must break the $0.0180 and $0.0184 resistance levels to continue higher in the near term.
TRON price is trading with a bearish bias against the US Dollar and bitcoin. TRX price could decline sharply towards $0.0165 or $0.0160 before it starts a decent recovery.
Tron Price Analysis
This past week, TRON price extended its decline below the $0.0170 level against the US Dollar. The TRX/USD pair even broke the $0.0165 support level and closed below the 55 simple moving average (4-hours). A swing low was formed near $0.0162 before the price started an upside correction. There was a decent recovery above $0.0170 and $0.0180. Moreover, the price climbed above $0.0182 and the 55 simple moving average (4-hours).
However, the price failed to climb above a major resistance near $0.0184. A swing high was formed near $0.01839 and the price recently declined below $0.0180. Additionally, it traded below the 23.6% Fibonacci retracement level of the upward move from the $0.0162 low to $0.0184 swing high. On the downside, an immediate support is near the $0.0173 level.
The 50% Fibonacci retracement level of the upward move from the $0.0162 low to $0.0184 swing high is also near the $0.0173 level. If the price fails to hold $0.0173, it could decline towards the $0.0170 support. The main support is near the $0.0165 level, below which there are chances of a strong bearish wave. On the upside, there are many key resistances near $0.0180 and $0.0182.
Moreover, there is a connecting bearish trend line forming with resistance near $0.0180 on the 4-hours chart. The main resistance is near the $0.0184 level. An upside break above the $0.0184 resistance is needed for more gains. The next stop for the bulls might be near the $0.0195 and $0.0200 levels.
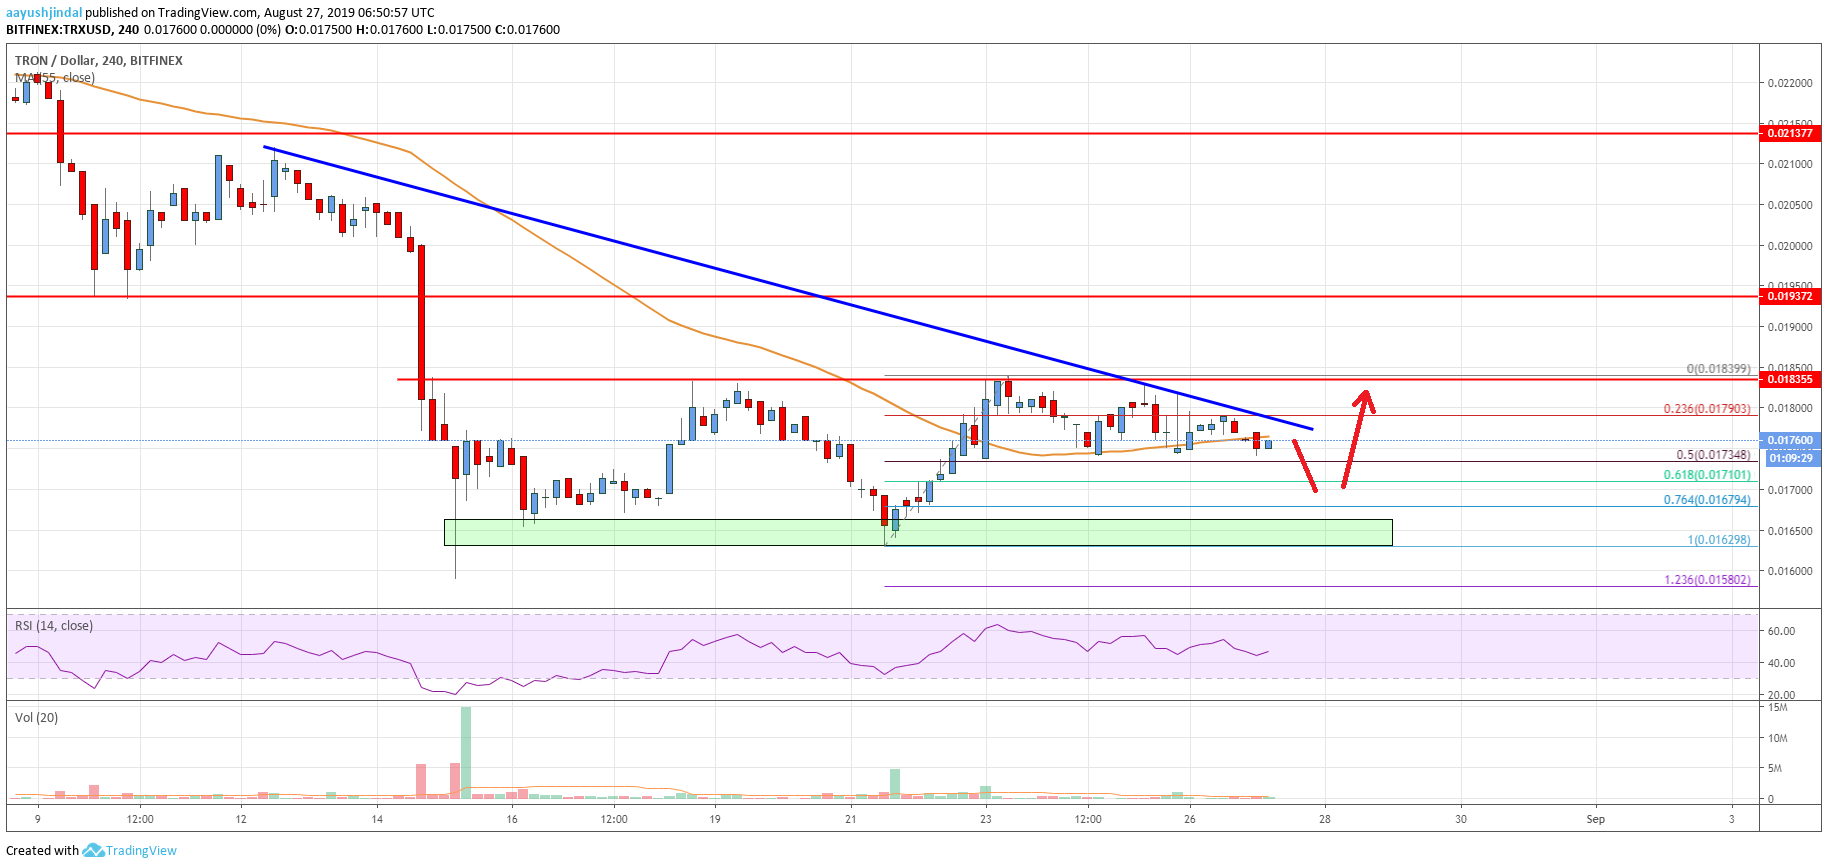
The chart indicates that TRX price is facing an uphill task near the $0.0180 and $0.0184 levels. If there is a successful close above $0.0184, the price could start a strong upward move. If not, there is a risk of a sharp decline towards $0.0165 or $0.0160 before the price starts a decent recovery in the coming days.
Technical Indicators
4 hours MACD – The MACD for TRX/USD is struggling to gain momentum in the bullish zone.
4 hours RSI – The RSI for TRX/USD is currently above 40 and it could rise towards the 50 level.
Key Support Levels – $0.0170 and $0.0165.
Key Resistance Levels – $0.0180, $0.0185 and $0.0195.


Leave a Reply
You must be logged in to post a comment.