
- Tron price failed to climb above the $0.0235 resistance and declined recently against the US Dollar.
- TRX price is currently trading in a strong downtrend below the $0.0215 resistance.
- There is a major bearish trend line forming with resistance near $0.0210 on the 4-hours chart (data feed via Bitfinex).
- The price is likely to decline further towards the $0.0190 and $0.0175 support levels in the near term.
TRON price is trading with a bearish bias against the US Dollar and bitcoin. TRX price could continue to weaken unless it recovers above $0.0215 and $0.0220.
Tron Price Analysis
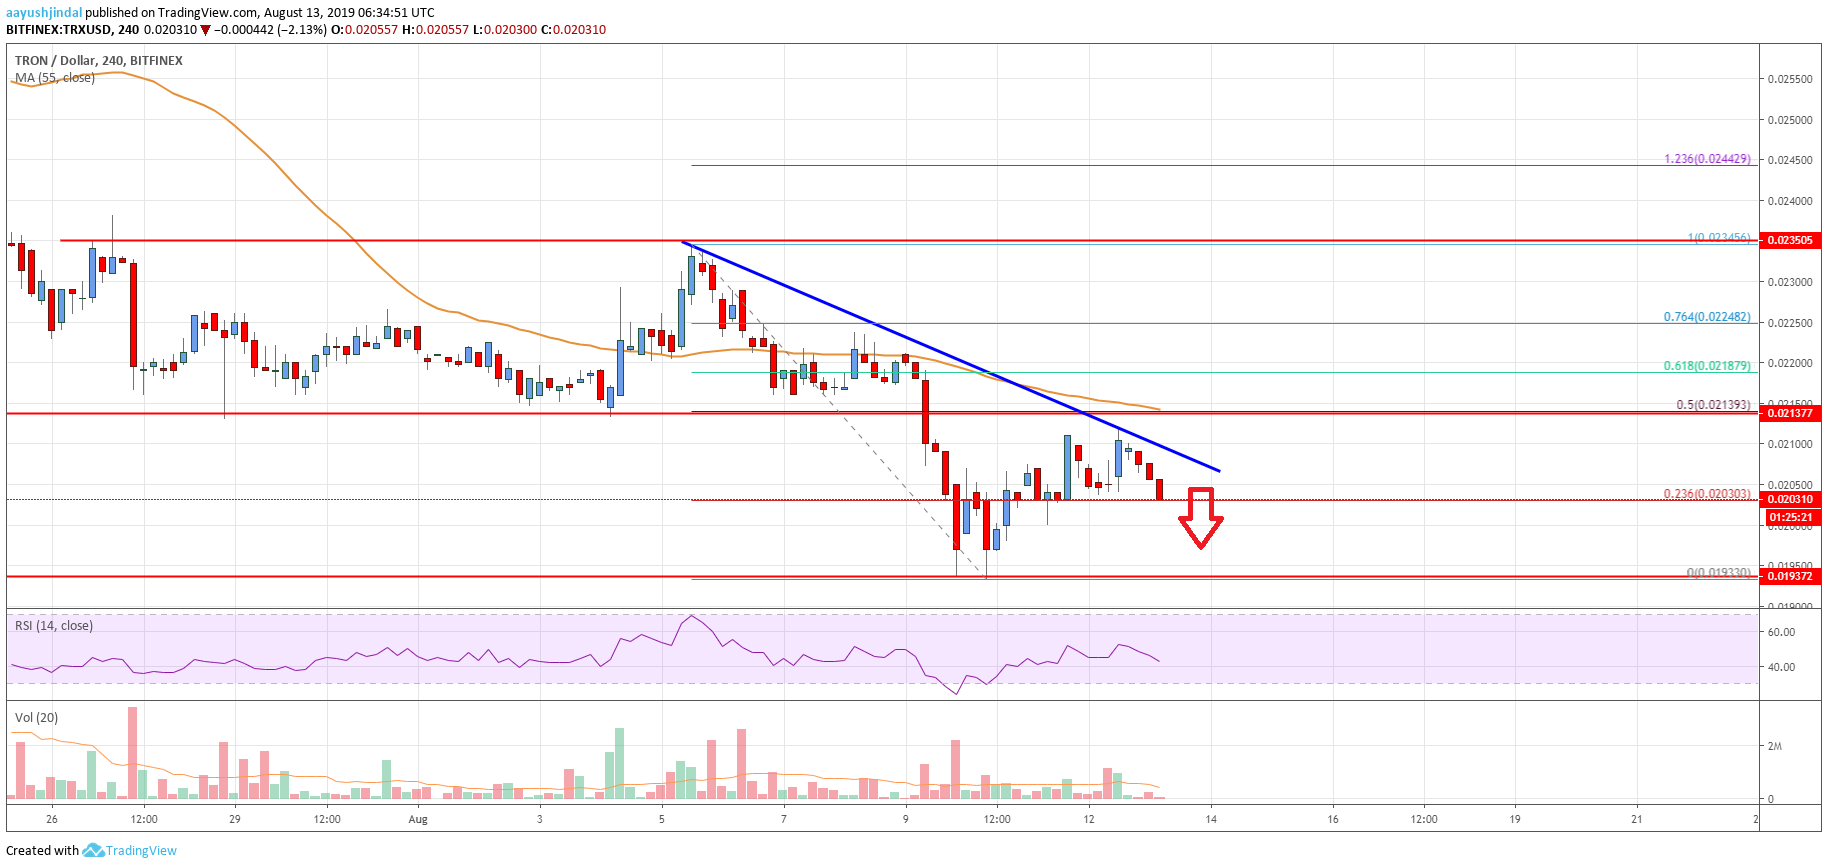
This past week, TRON price made another attempt to climb above the $0.0235 resistance against the US Dollar. However, the TRX/USD pair failed to continue higher and started a fresh decline below $0.0230. There was a break below the $0.0220 support and the 55 simple moving average (4-hours). Moreover, the price settled below the $0.0215 pivot level and broke the $0.0200 support.
A new monthly low was formed near $0.0193 and the price recently corrected higher. It traded above the 23.6% Fibonacci retracement level of the last slide from the $0.0234 high to $0.0193 low. Additionally, the price recovered above $0.0200, but it struggled to clear the $0.0210 level. More importantly, there is a major bearish trend line forming with resistance near $0.0210 on the 4-hours chart.
Above the trend line, the main resistance is near the $0.0215 level. The 50% Fibonacci retracement level of the last slide from the $0.0234 high to $0.0193 low is also near the $0.0214 level to act as a strong resistance. Finally, the 55 SMA is near the $0.0214 level. Therefore, the bulls are likely to face a strong resistance near $0.0210, $0.0214 and $0.0215.
On the downside, an immediate support is near the $0.0200 level. If there is a downside break below $0.0200, the price could continue to decline and it might even trade below the $0.0193 low. The next key support is at $0.0190, below which the price could decline towards $0.0175.
The chart indicates that TRX price is under a lot of selling pressure below $0.0215 and $0.0220. As long as the price is trading below the $0.0215 pivot level, there is a risk of more downsides. A daily close below the $0.0200 level is likely to spark another strong decline. In the mentioned case, the bears are likely to aim the $0.0175 support area.
Technical Indicators
4 hours MACD – The MACD for TRX/USD is gaining pace in the bearish zone.
4 hours RSI – The RSI for TRX/USD is currently moving lower and is well below the 50 level.
Key Support Levels – $0.0200 and $0.0190.
Key Resistance Levels – $0.0210, $0.0215 and $0.0220.


Leave a Reply
You must be logged in to post a comment.