- Tron price is holding an important support near the $0.0215 level against the US Dollar.
- TRX price is currently consolidating above $0.0220 and preparing for the next move.
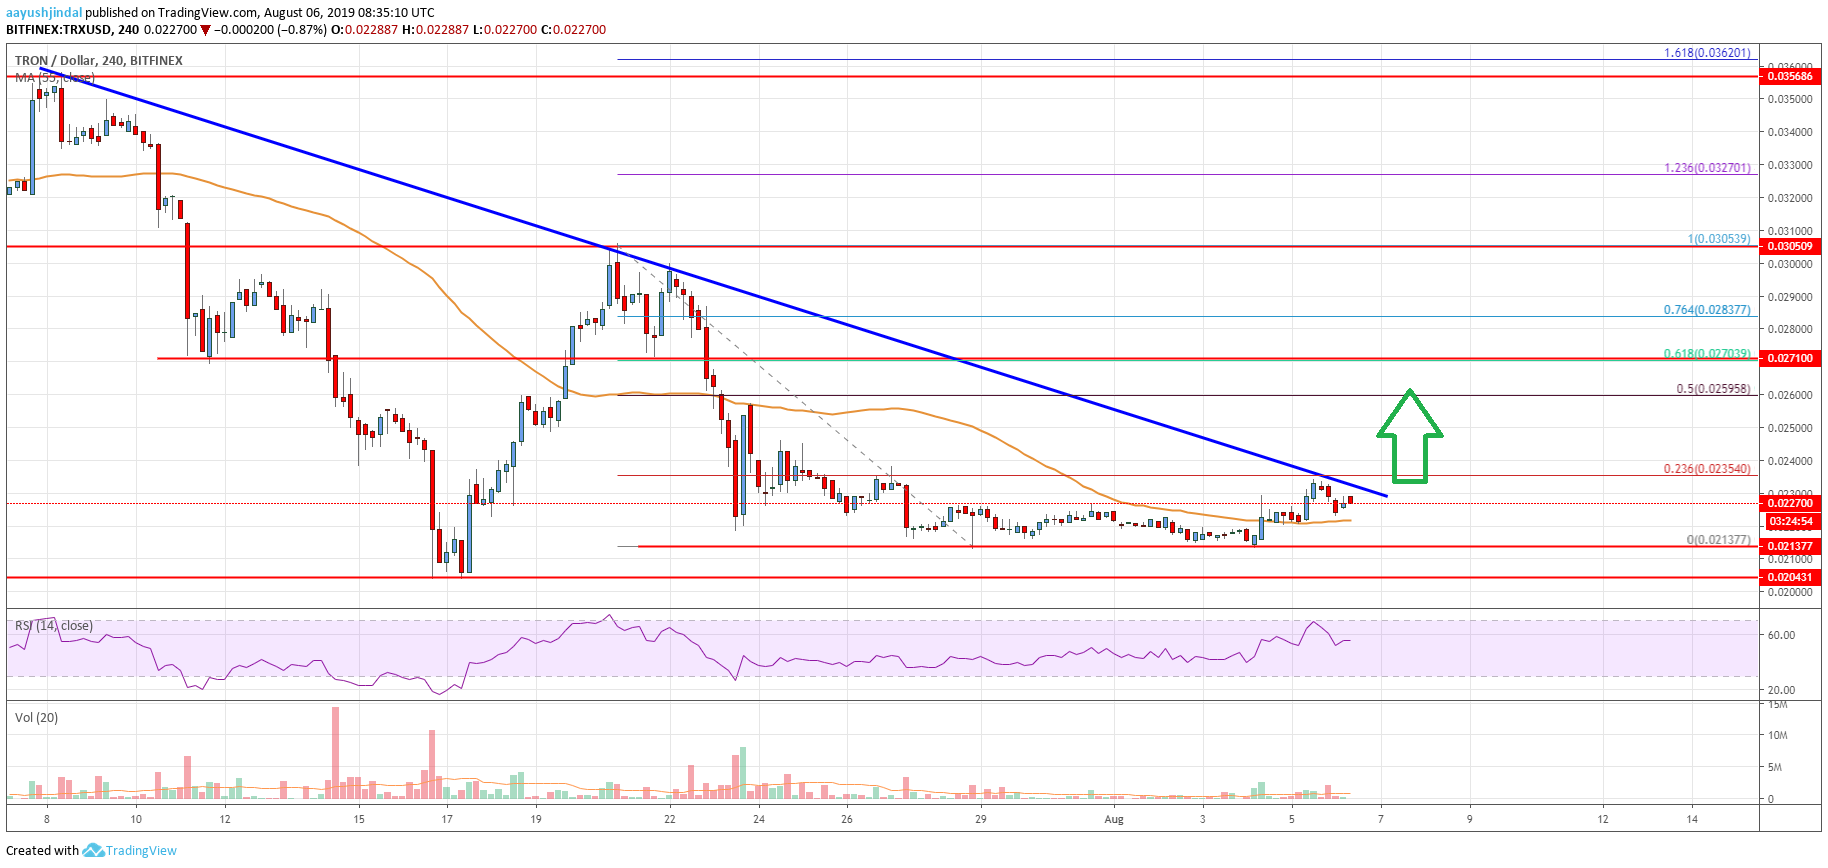
- There is a crucial bearish trend line forming with resistance near $0.0235 on the 4-hours chart (data feed via Bitfinex).
- The price could either rally above $0.0235 and $0.0240 or it could decline below $0.0210.
TRON price is currently in a brief consolidation phase against the US Dollar, while declining vs bitcoin. TRX price might soon break to the upside above $0.0235 and $0.0240.
Tron Price Analysis
In the past few days, TRON price traded in a range above the $0.0210 support against the US Dollar. The TRX/USD pair made many attempts to recover, but upsides were capped near $0.0230 and $0.0235. Moreover, the bears made many attempts to push the price below the $0.0215 and $0.0210 support levels. However, they failed and the price stayed above the $0.0210 level. The last swing low was formed near $0.0213 and the price is currently trading in a range above the 55 simple moving average (4-hours).
An immediate resistance is near the key $0.0235 level. It represents, the 23.6% Fibonacci retracement level of the downward move from the $0.0305 high to $0.0213 low. More importantly, there is a crucial bearish trend line forming with resistance near $0.0235 on the 4-hours chart. A clear break above the trend line might open the doors for more gains above the $0.0240 resistance.
The next major resistance is near the $0.0250 zone. Moreover, the 50% Fibonacci retracement level of the downward move from the $0.0305 high to $0.0213 low is near $0.0255. If there are more gains, the price may even break the $0.0270 and $0.0275 resistance levels.
Conversely, if the price fails to climb above the $0.0235 and $0.0240 resistance levels, it could decline again. An immediate support is near the $0.0220 level and the 55 simple moving average (4-hours). The main supports are $0.0215 and $0.0210, below which the price could turn heavily bearish in the near term.

The chart indicates that TRX price is clearly trading in a broad range above the $0.0215 support. If there is an upside break above the $0.0235 and $0.0240 resistance levels, there could be steady gains. The next key resistances are near $0.0250 and $0.0255. Any further gains could even open the doors for a push towards the $0.0300 level.
Technical Indicators
4 hours MACD – The MACD for TRX/USD could move into the bullish zone.
4 hours RSI – The RSI for TRX/USD is currently just above the 50 level, with a minor bearish angle.
Key Support Levels – $0.0215 and $0.0210.
Key Resistance Levels – $0.0235, $0.0240 and $0.0250.


Leave a Reply
You must be logged in to post a comment.