- ADA price followed a bullish path above $0.0320, but it faced hurdles near $0.0370 against the US Dollar.
- It is currently correcting lower and trading below the $0.0350 level.
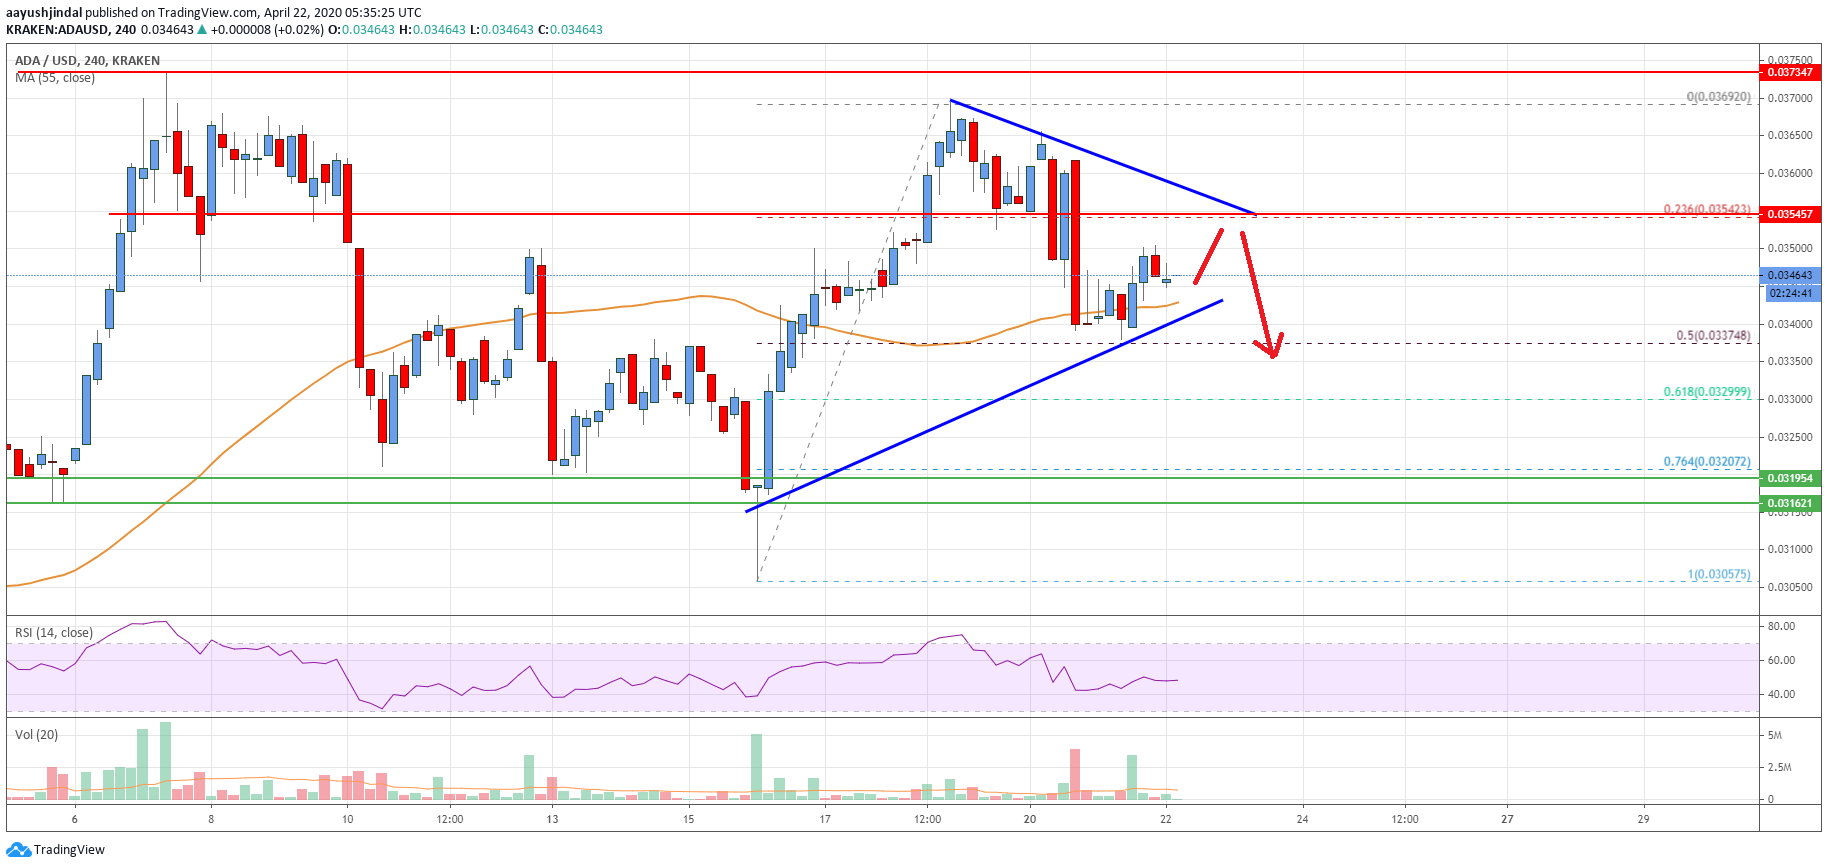
- There is a key contracting triangle forming with resistance near $0.0355 on the 4-hours chart (data feed via Kraken).
- The price could continue to move down if it breaks the $0.0340 support area.
Cardano price is currently showing signs of weakness against the US Dollar, similar to bitcoin. ADA price must surpass the $0.0360 and $0.0370 resistance levels to turn bullish.
Cardano Price Analysis
This past week, cardano price started a strong increase from the $0.0320 support area against the US Dollar. The ADA/USD pair surpassed the $0.0350 resistance to move into a positive zone.
The price even spiked above $0.0365 level and settled above the 55 simple moving average (4-hours). However, the bulls failed to remain in action and the price formed a short term top near the $0.0369 level.
As a result, there was a downside correction below the $0.0360 level. The price even traded below the 23.6% Fibonacci retracement level of the upward move from the $0.0305 swing low to $0.0369 high.
However, the $0.0340 level is currently acting as a decent support along with the 55 simple moving average (4-hours). The 50% Fibonacci retracement level of the upward move from the $0.0305 swing low to $0.0369 high is also acting as a support.
It seems like there is a key contracting triangle forming with resistance near $0.0355 on the 4-hours chart. The channel support is near the $0.0340 level, below which the price is likely to accelerate lower.
The next major support is near the $0.0320 level, where the bulls are likely to appear again. Any further losses may perhaps lead the price towards the $0.0300 support zone.
On the upside, there is a key resistance zone forming near the $0.0360 and $0.0370 levels. A successful close above the $0.0370 level is likely to start a strong upward move towards the $0.0400 barrier in the near term.

The chart indicates that ADA price is showing a few bearish signs below the $0.0360 and $0.0370 levels. Having said that, the price might recover and surge nicely as long as there is no daily close below $0.0320.
Technical Indicators
4 hours MACD – The MACD for ADA/USD is struggling to gain momentum in the bullish zone.
4 hours RSI – The RSI for ADA/USD is now close to the 50 level.
Key Support Levels – $0.0340 and $0.0320.
Key Resistance Levels – $0.0360 and $0.0370.


Leave a Reply
You must be logged in to post a comment.