- Ethereum price started a downside correction from the $1,800 zone against the US Dollar.
- ETH price is now trading below $1,700 and the 55 simple moving average (4-hours).
- There is a major bullish trend line forming with support near $1,540 on the 4-hours chart (data feed from Coinbase).
- The pair could start a fresh increase unless there is a clear move below the $1,500 zone.
Ethereum price is correcting lower below $1,700 against the US Dollar. ETH/USD could rise again if it stays above the $1,500 support zone.
Ethereum Price Analysis
This past week, ethereum saw a decent increase above the $1,500 zone against the US Dollar. ETH price was able to clear the $1,550 and $1,600 resistance levels.
The price rallied sharply above the $1,650 and $1,700 levels. It even climbed above the $1,720 level and settled above the 55 simple moving average (4-hours). However, it formed a high near the $1,792 level and recently started a downside correction.
There was a move below the $1,650 level. The price is now trading near the 50% Fib retracement level of the upward move from the $1,356 swing low to $1,792 high.
On the downside, an initial support is near the $1,575 level. The next major support is now near the $1,520 level. There is also a major bullish trend line forming with support near $1,540 on the 4-hours chart. The trend line is near the 61.8% Fib retracement level of the upward move from the $1,356 swing low to $1,792 high.
A break below the $1,500 support could push the price to $1,420. Any more losses could lead the price towards $1,350 or even $1,300.
An immediate resistance is near the $1,650 level. The next major resistance is near the $1,700 zone or $1,750, above which the price could rise towards the $1,880 level. Any more gains could even send the price above the $1,950 resistance zone.
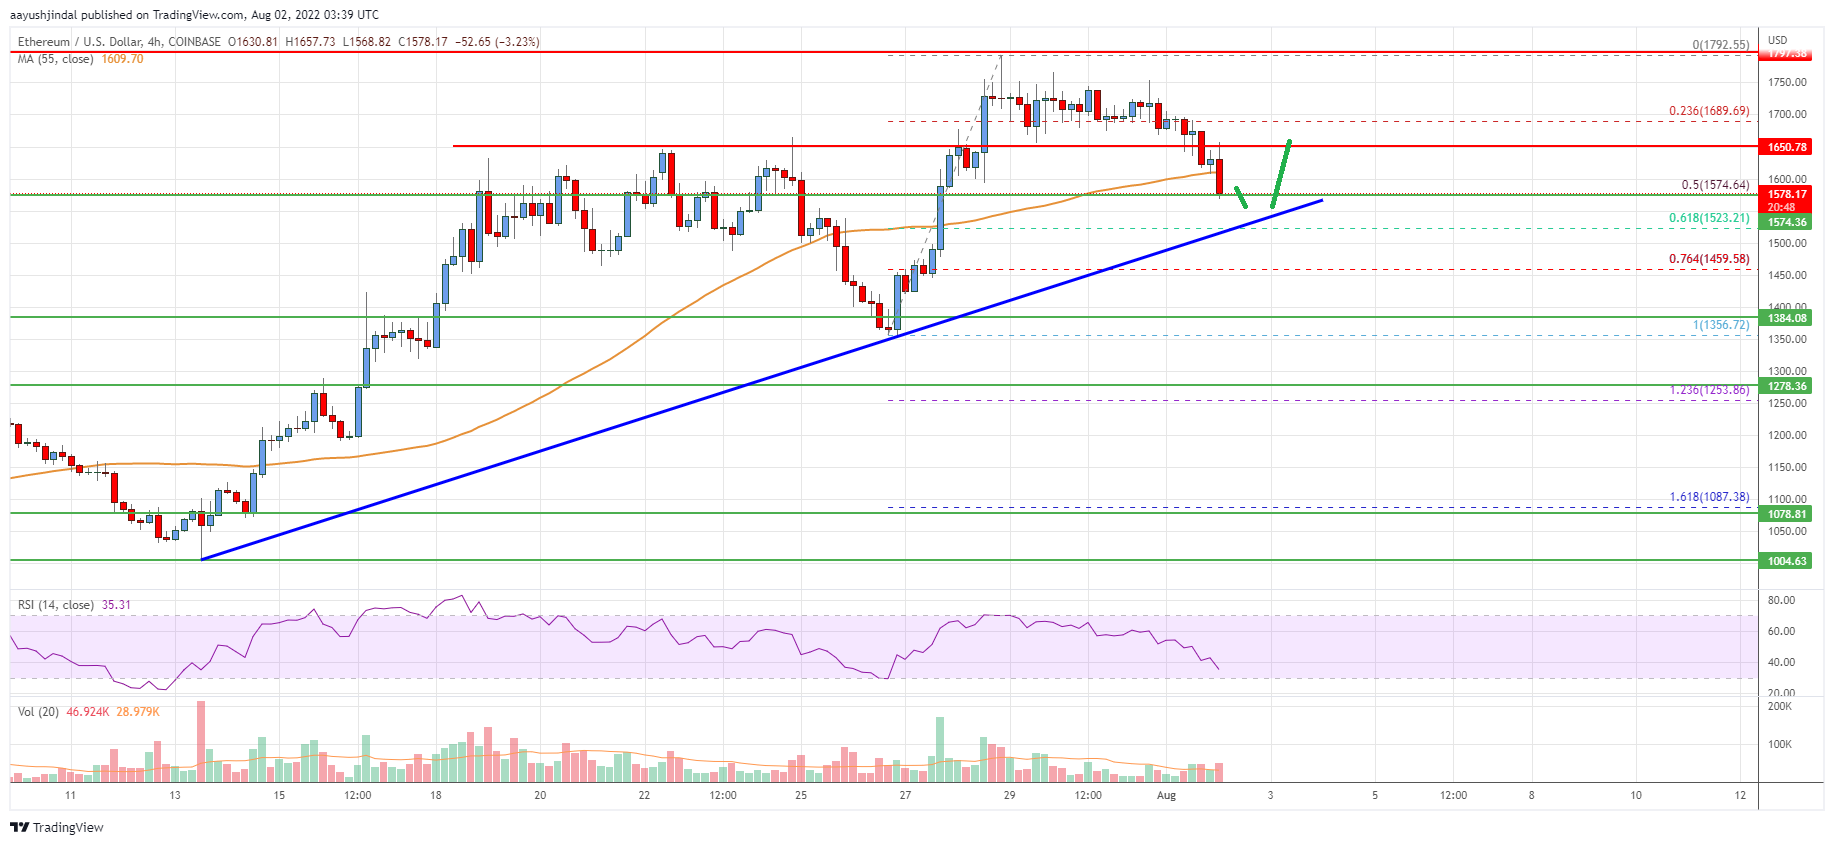
Looking at the chart, Ethereum price is clearly trading below the $1,700 zone and the 55 simple moving average (4-hours). Overall, ether price could start a fresh increase unless there is a clear move below the $1,500 zone.
Technical indicators
4 hours MACD – The MACD for ETH/USD is now gaining momentum in the bearish zone.
4 hours RSI (Relative Strength Index) – The RSI for ETH/USD is now below the 50 level.
Key Support Levels – $1,520, followed by the $1,400 zone.
Key Resistance$ Levels – $1,650 and $1,700.
