
- Litecoin price declined heavily after it failed to clear the $50.00 resistance against the US Dollar.
- LTC price traded as low as $39.40 and it is currently correcting higher.
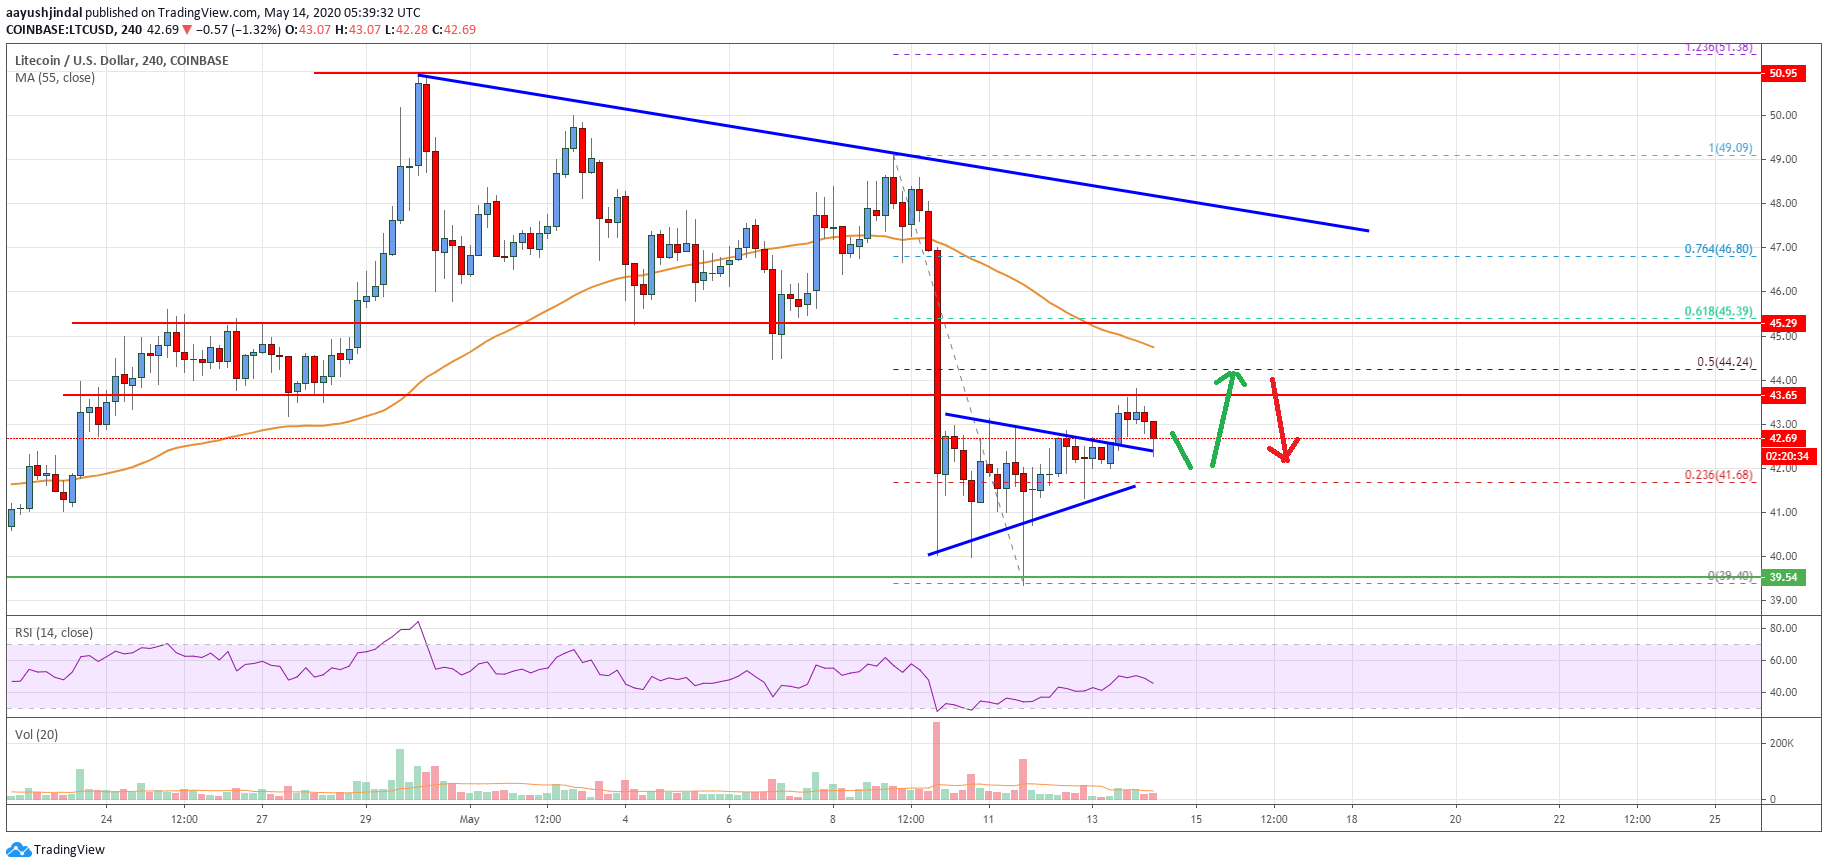
- There was a break above a short term contracting triangle with resistance near $42.60 on the 4-hours chart of the LTC/USD pair (data feed from Coinbase).
- The pair could spike towards the $44.00 and $45.00 resistance levels in the near term.
Litecoin price is showing sign of a decent upward move against the US Dollar and bitcoin. However, LTC price is likely to face a strong selling interest near the $45.00 zone.
Litecoin Price Analysis
This past week, there was a sharp bearish reaction in Ethereum, ripple, and litecoin against the US Dollar, while bitcoin remained in a bullish zone. Earlier, LTC price broke many key supports near $45.00 to move into a bearish zone.
The price even dived below the $42.00 support and settled below the 55 simple moving average (4-hours). A new monthly low is formed near $39.40 and the price is currently correcting higher.
There was a break above the $42.00 resistance. The price surpassed the 23.6% Fib retracement level of the key decline from the $49.09 high to $39.40 low. Moreover, there was a break above a short term contracting triangle with resistance near $42.60 on the 4-hours chart of the LTC/USD pair.
The pair is now facing an immediate hurdle near the $43.65 level. The first major resistance is near the $44.20 zone and the 55 simple moving average (4-hours).
The 50% Fib retracement level of the key decline from the $49.09 high to $39.40 low could also protect gains near the $44.20 level. To move into a positive zone, the price must climb above the $44.00 and $45.00 resistance levels in the near term.
A successful close above the 55 simple moving average (4-hours) and $45.00 could lead the price towards $50.00. If not, the price is likely to resume its decline below the $42.00 level. The main support on the downside is near $40.00, below which the price could revisit $36.00.
Looking at the chart, litecoin price is clearly approaching a few important resistances near $44.00 and $45.00. As long as there is no close above $45.00, there is a risk of another decline in the near term.
Technical indicators
4 hours MACD – The MACD for LTC/USD is slowly losing momentum in the bullish zone.
4 hours RSI (Relative Strength Index) – The RSI for LTC/USD is struggling to move above the 50 level.
Key Support Levels – $42.00 and $40.00.
Key Resistance Levels – $44.00 and $45.00.


Leave a Reply
You must be logged in to post a comment.