- Ripple price rallied above the $0.2000 resistance before correcting lower against the US dollar.
- The price is currently trading above the $0.1980 support and the 55 simple moving average (4-hours).
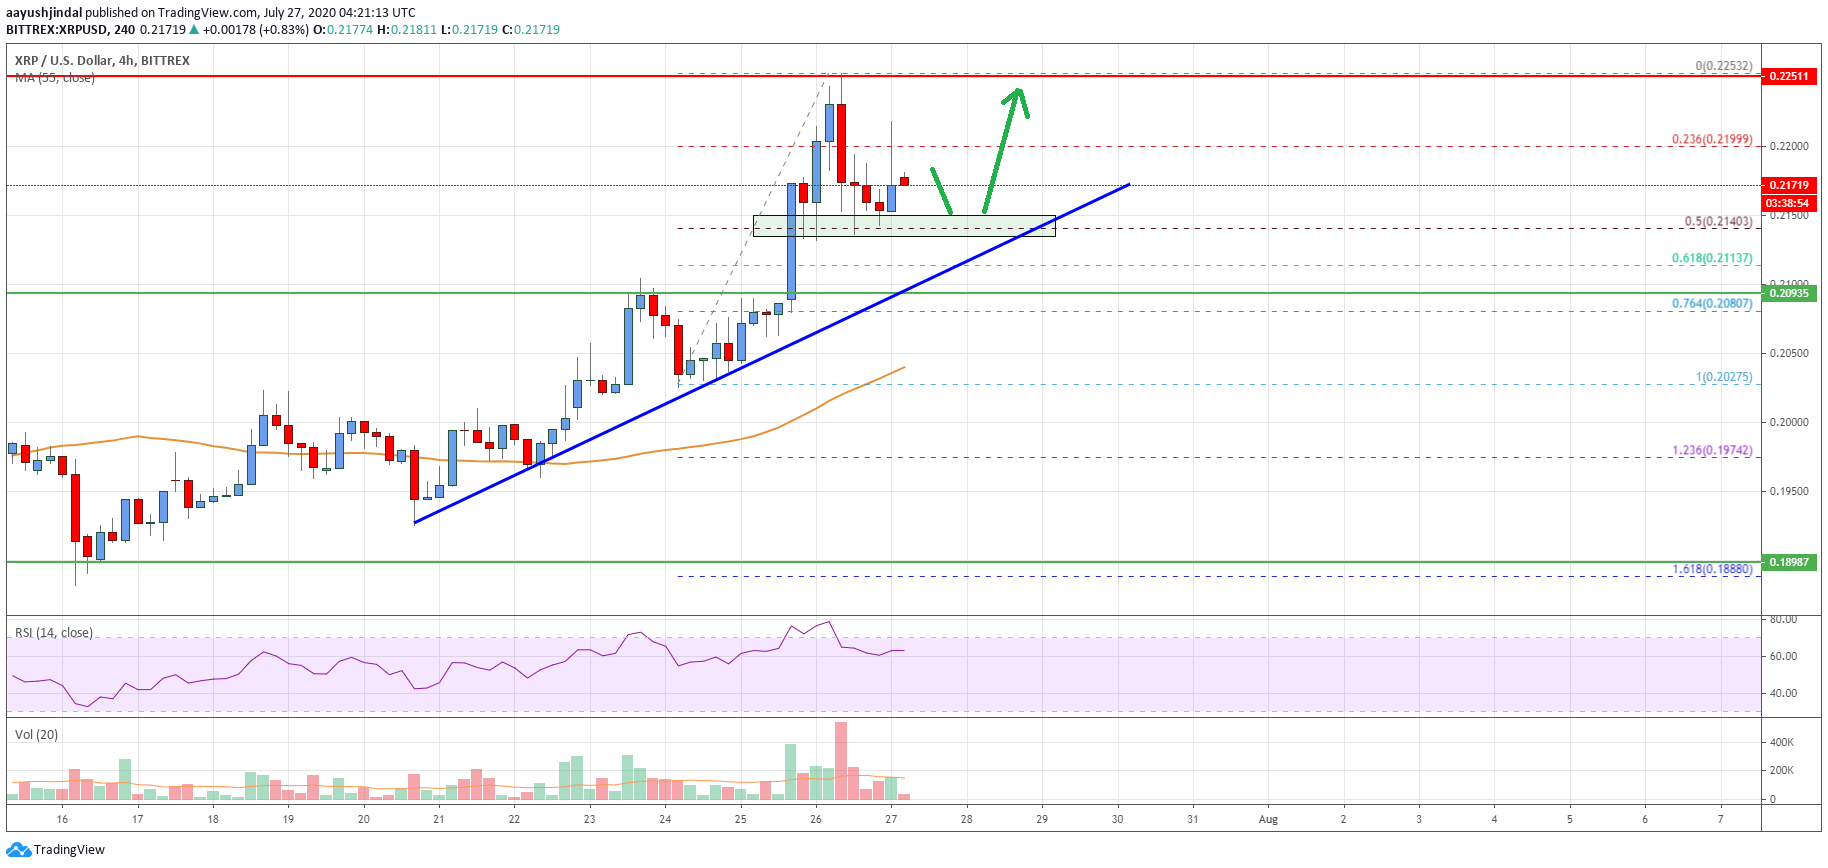
- There is a crucial breakout pattern forming with resistance near $0.2000 on the 4-hours chart of the XRP/USD pair (data source from Bittrex).
- The pair is showing signs of more gains above the $0.2000 and $0.2020 resistance levels.
Ripple price is trading in a positive zone above $0.1980 and $0.1900 against the US Dollar. XRP price is likely to start a fresh rally above $0.2000 as long as it is above $0.1900.
Ripple Price Analysis
This past week, ripple price started a strong rally above the $0.1920 and $0.1950 resistance levels against the US Dollar. The XRP/USD pair even broke the $0.2000 resistance and settled above the 55 simple moving average (4-hours).
It traded to a new monthly high at $0.2115 and recently started a downside correction. There was a break below the $0.2050 and $0.2020 support levels. The price even broke the 50% Fib retracement level of the upward move from the $0.1834 low to $0.2115 high.
However, the price found support near the $0.1950 level. It seems like the price remained well bid above the 61.8% Fib retracement level of the upward move from the $0.1834 low to $0.2115 high.
There is also a crucial breakout pattern forming with resistance near $0.2000 on the 4-hours chart of the XRP/USD pair. On the upside, the $0.2000 level is a strong resistance. A successful break above the $0.2000 resistance might open the doors for a larger upward move.
The next key resistance is near the $0.2050 level, above which the bulls are likely to aim a test of the $0.2120 level or even $0.2150. Conversely, the price might fail to surpass the $0.2000 resistance and extend its decline.
An initial support on the downside is near the $0.1980 and $0.1970 levels. The main support is near $0.1920, $0.1900, and the 55 simple moving average (4-hours). A close below the $0.1900 support could start a sustained decline in the near term.

Looking at the chart, ripple price is clearly preparing for the next major break above $0.2000. It seems like it might start a fresh rally above $0.2000 as long as it is above $0.1900.
Technical indicators
4 hours MACD – The MACD for XRP/USD is likely to move back into the bullish zone.
4 hours RSI (Relative Strength Index) – The RSI for XRP/USD is flat above the 50 level.
Key Support Levels – $0.1980, $0.1920 and $0.1900.
Key Resistance Levels – $0.2000 and $0.2050.


Leave a Reply
You must be logged in to post a comment.