- Ripple price started a strong upward move above $0.2950 and $0.3000 hurdles against the US dollar.
- The price rallied towards the $0.3420 level and recently corrected lower to $0.3020.
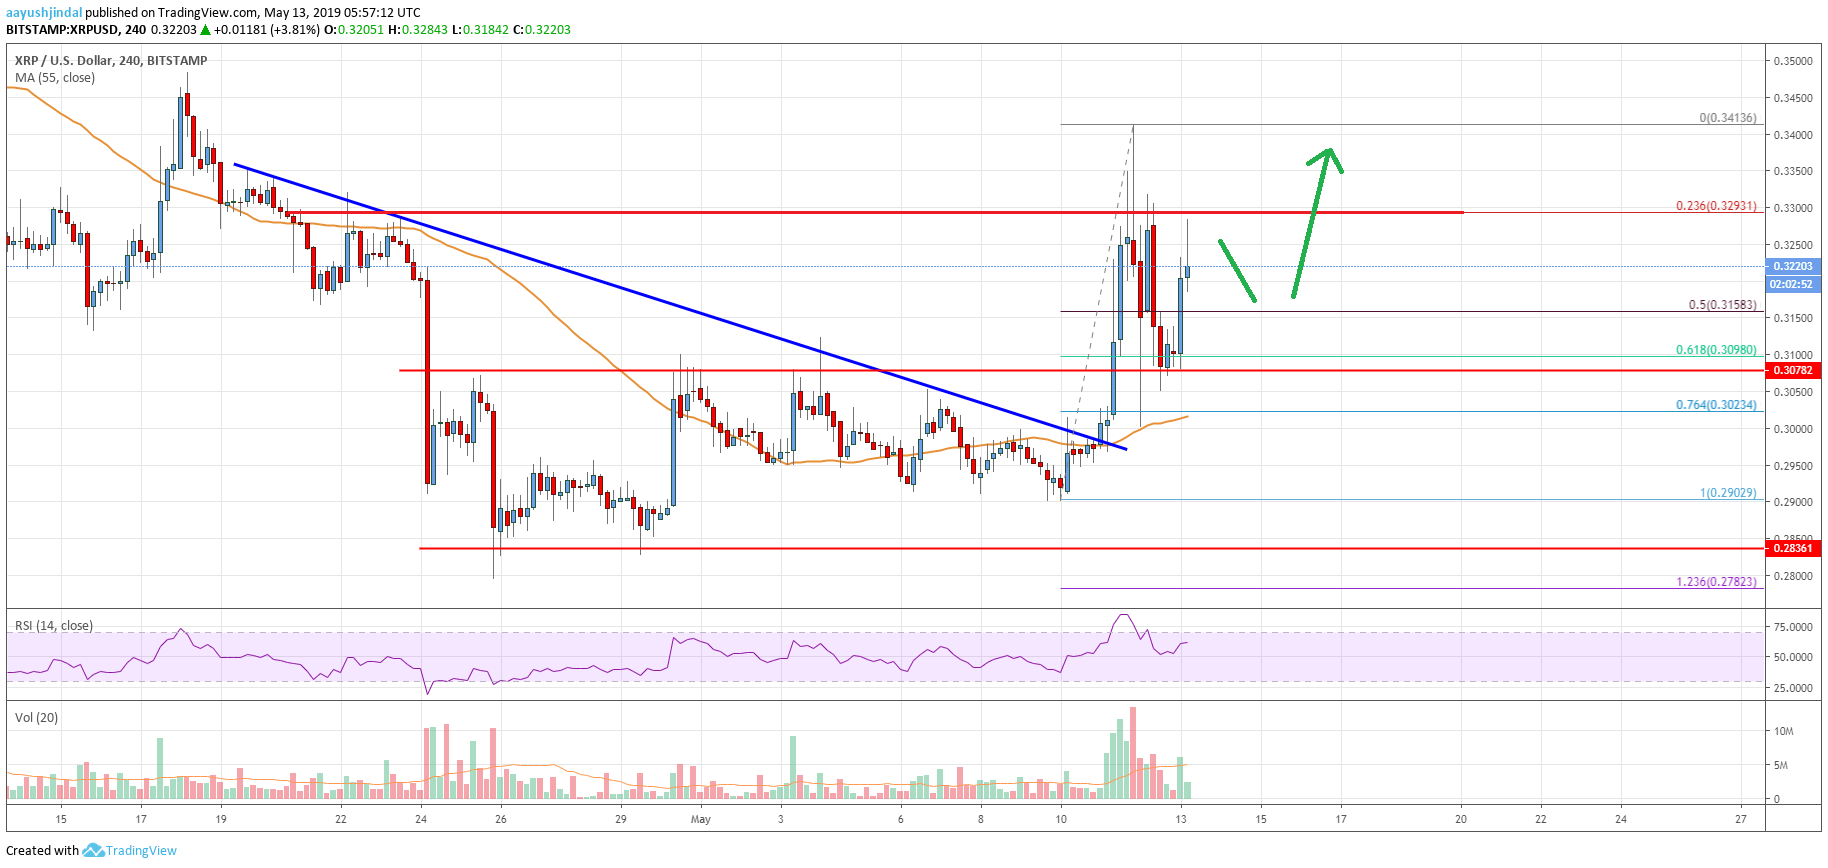
- There was a break above a major bearish trend line with resistance near $0.2950 on the 4-hours chart of the XRP/USD pair (data source from Bitstamp).
- The price is currently holding the key $0.3120, $0.3100 and $0.3075 support levels.
Ripple price finally climbed above $0.3300 against the US Dollar. XRP corrected lower sharply, but it held the key $0.3075 support and is currently moving higher towards $0.3400.
Ripple Price Analysis
In the past few days, there was a strong rise in bitcoin, Ethereum, bitcoin cash, ADA and ripple against the US Dollar. The XRP/USD pair formed a support base near the $0.2840 level and later started a decent upward move. During the rise, it broke the key $0.2900 and $0.2920 resistance levels to move into a positive zone. Besides, there was a close above the $0.3000 pivot level and the 55 simple moving average (4-hours).
More importantly, there was a break above a major bearish trend line with resistance near $0.2950 on the 4-hours chart of the XRP/USD pair. The pair rallied above the $0.3240 and $0.3320 resistance levels. There was even a spike above the $0.3400 level, but the price failed to stay above $0.3400. As a result, there was a sharp correction below the $0.3240 support. The price traded below the 50% Fib retracement level of the last wave from the $0.2902 low to $0.3413 high. However, the price found support near the $0.3020 level and the 55 simple moving average (4-hours).
XRP price tested the 76.4% Fib retracement level of the last wave from the $0.2902 low to $0.3413 high, and recently bounced back. It is currently trading above the $0.3150 level and the $0.3200 resistance. An immediate resistance is at $0.3240, above which the price may test the $0.3285-0.3290 resistance zone. A successful close above the $0.3300 level is likely to clear the path for a solid increase above the $0.3400 level in the near term.

Looking at the chart, ripple price moved into a positive zone above $0.3075 and $0.3150. The current price action is positive and suggests further upsides above the $0.3240 level. If there is a downside correction, the price is likely to find a strong buying interest near the $0.3120 and $0.3075 levels.
Technical indicators
4 hours MACD – The MACD for XRP/USD is gaining momentum in the bullish zone.
4 hours RSI (Relative Strength Index) – The RSI for XRP/USD is now well above the 55 level.
Key Support Levels – $0.3150, $0.3120 and $0.3075.
Key Resistance Levels – $0.3240 and $0.3300.


Leave a Reply
You must be logged in to post a comment.