- Ripple price declined heavily after it broke the key $0.3750 support area against the US dollar.
- The price even broke the $0.3500 support level and traded to a new multi-week low at $0.2899.
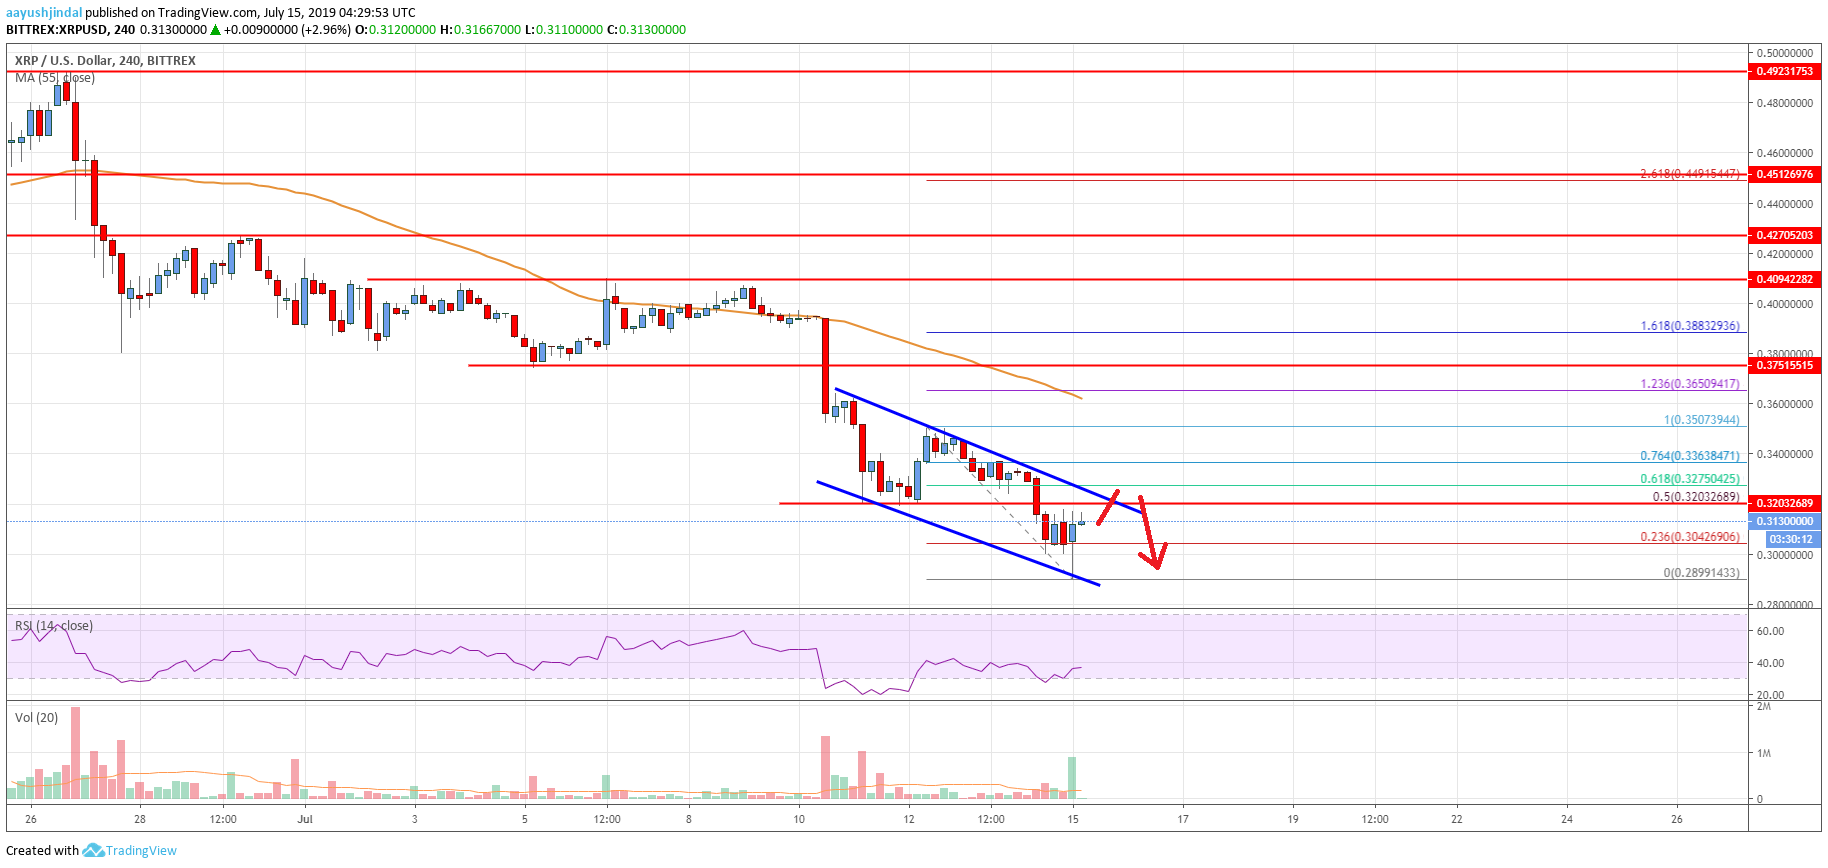
- There is a declining channel forming with resistance near $0.3205 on the 4-hours chart of the XRP/USD pair (data source from Bittrex).
- The price could correct higher, but the bulls are likely to face resistance near $0.3250 and $0.3360.
Ripple price is under a lot of pressure below the $0.3250 pivot level against the US Dollar. XRP price might decline further if it struggles to trade above $0.3250 and $0.3360.
Ripple Price Analysis
This past week, there was a fresh decrease in bitcoin, Ethereum, bitcoin cash, ADA and ripple against the US Dollar. The XRP/USD pair failed to climb above the $0.4090 and $0.4100 resistance levels. As a result, there was a strong decline below the $0.3750 support level. Moreover, there was a break below the $0.3500 support area and the 55 simple moving average (4-hours). It opened the doors for more losses and the price even broke the $0.3000 support.
A swing low was formed at $0.2988 and the price is currently correcting higher. It broke the $0.3050 level plus the 23.6% Fib retracement level of the recent drop from the $0.3507 low to $0.2988 high. However, there are many resistances near the $0.3200 and $0.3250 levels. Moreover, there is a declining channel forming with resistance near $0.3205 on the 4-hours chart of the XRP/USD pair.
The 50% Fib retracement level of the recent drop from the $0.3507 low to $0.2988 high is also near the $0.3204 level to act as a resistance. If there is a recovery above $0.3200 and $0.3250, the price could test the next major resistance is near $0.3360. The main resistance for the current downtrend is at $0.3500, above which the price may move into a positive zone.
On the downside, the $0.3000 level is a decent support. If there is a daily close below $0.3000, the price may perhaps decline heavily below $0.2900 in the coming sessions. The next key supports are near $0.2850 and $0.2620.

Looking at the chart, ripple price is clearly trading in a major downtrend below $0.3360 and $0.3500. As long as the price is trading below the $0.3500 pivot level, there is a risk of more losses below the $0.3000 and $0.2900 levels in the near term.
Technical indicators
4 hours MACD – The MACD for XRP/USD is slowly losing momentum in the bearish zone.
4 hours RSI (Relative Strength Index) – The RSI for XRP/USD is currently recovering above the 30 level.
Key Support Levels – $0.3000, $0.2900 and $0.2850.
Key Resistance Levels – $0.3250 and $0.3360.


Leave a Reply
You must be logged in to post a comment.