- Stellar lumen price is struggling to gain momentum above the $0.0650 resistance against the US Dollar.
- XLM price is currently consolidating below the $0.0640 and $0.0650 resistance levels.
- There is a significant breakout pattern forming with support near $0.0622 on the 4-hours chart (data feed via Kraken).
- The pair could either rally above $0.0650 or it might start a downside correction to $0.0600.
Stellar lumen price is facing an uphill task against the US Dollar and bitcoin. XLM price might dip one more time before it could rise towards $0.0700.
Stellar Lumen Price Analysis (XLM to USD)
After forming a support base near $0.0580, stellar lumen price started a fresh rebound against the US Dollar. The XLM/USD pair surpassed the main $0.0600 and $0.0620 resistance levels to move into a positive zone. Moreover, there was a close above the $0.0620 resistance area and the 55 simple moving average (4-hours). Finally, the price spiked above the $0.0650 resistance, but it failed to continue higher.
A swing high was formed near $0.0665 and the price corrected gains. The last swing high was near $0.0651 and the recent low was $0.0619. At the moment, the price is holding the $0.0620 support and the 55 simple moving average (4-hours). Additionally, it climbed above the 50% Fibonacci retracement level of the recent decline from the $0.0651 high to $0.0619 low.
However, the price is facing resistance near the $0.0640 level. It seems like the 61.8% Fibonacci retracement level of the recent decline from the $0.0651 high to $0.0619 low is also acting as a resistance. Moreover, there is a significant breakout pattern forming with support near $0.0622 on the 4-hours chart. Therefore, a downside break below the $0.0620 support might call for an extended correction.
The next key support is near $0.0600, which has acted as a support and resistance on many occasions. If there are any further losses, stellar could even revisit the $0.0580 support area. On the upside, the $0.0640 and $0.0650 levels are important hurdles for the bulls.
Therefore, a successful close above the $0.0650 resistance is needed for a strong rise in the coming days. The next key resistances are near the $0.0680 and $0.0700 levels.
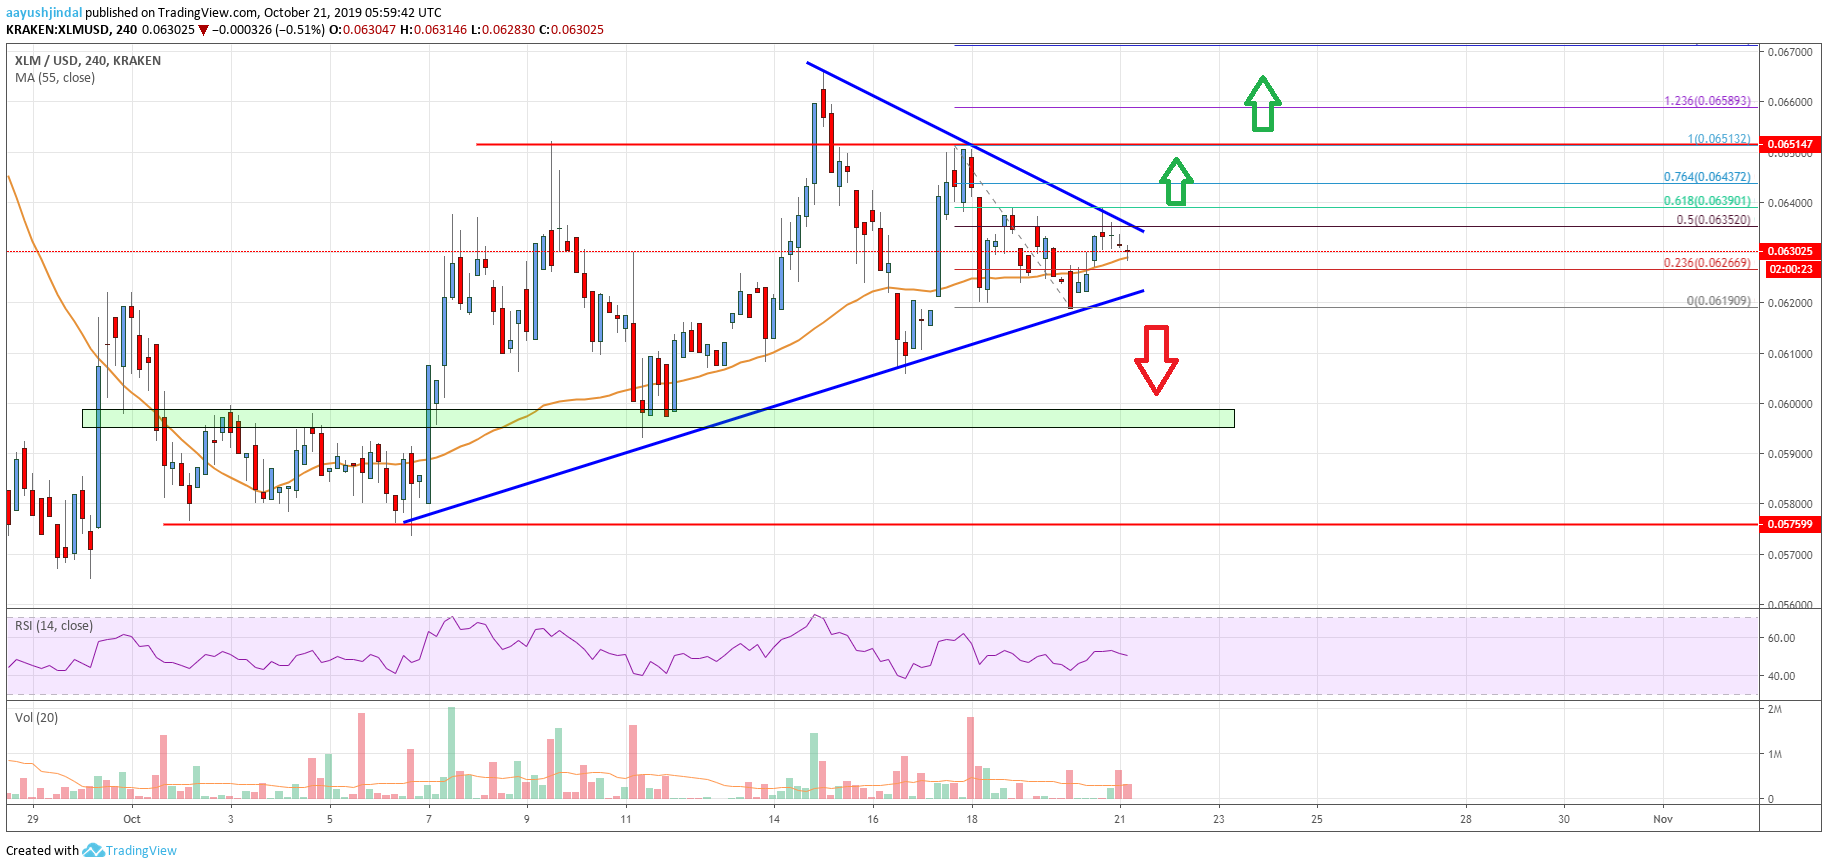
The chart indicates that XLM price is clearly facing hurdles near $0.0650. Thus, there are chances of a downside correction below the $0.0620 support. Having said that, the $0.0600 and $0.0580 are important supports and likely to prevent additional losses.
Technical Indicators
4 hours MACD – The MACD for XLM/USD is slowly moving into the bullish zone.
4 hours RSI – The RSI for XLM/USD is currently flat just above the 50 level.
Key Support Levels – $0.0620 and $0.0600.
Key Resistance Levels – $0.0640, $0.0650 and $0.0700.