
- Tron price started a fresh decline from the $0.0825 resistance against the US Dollar.
- TRX price is now trading below $0.0800 and near the 55 simple moving average (4-hours).
- There is a major bearish trend line forming with resistance near $0.0780 on the 4-hours chart (data feed via Bitfinex).
- The pair could start a major increase if there is a clear break above the $0.0780 resistance.
TRON price started a fresh decline below $0.0850 against the US Dollar, similar to bitcoin. TRX price is recovering, but it must clear $0.0780 for a steady wave.
Tron Price Analysis
After facing resistance, tron price started a fresh decline below the $0.0850 level against the US Dollar. TRX price even broke the $0.0780 support level to enter a bearish zone.
A low was formed near $0.0735 and the price started a recovery wave. There was a break above the $0.0750 level. There was a break above the 23.6% Fib retracement level of the downward move from the $0.0827 swing high to $0.0735 low.
The price even climbed above the $0.0770 level, but it is still below the 55 simple moving average (4-hours). An immediate resistance on the upside is near the $0.0780 level and the 55 simple moving average (4-hours).
There is also a major bearish trend line forming with resistance near $0.0780 on the 4-hours chart. It is near the 50% Fib retracement level of the downward move from the $0.0827 swing high to $0.0735 low. A close above $0.0780 is must for a fresh increase.
In the stated case, the price could rise towards the $0.0850 resistance in the near term. Any more gains could set the pace for a larger increase towards the $0.0920 level.
On the downside, an initial support is near the $0.0750 level. The first major support is now forming near $0.0735. The next major is near the $0.0720 level. Any more losses might call for a move towards the $0.0680 level.
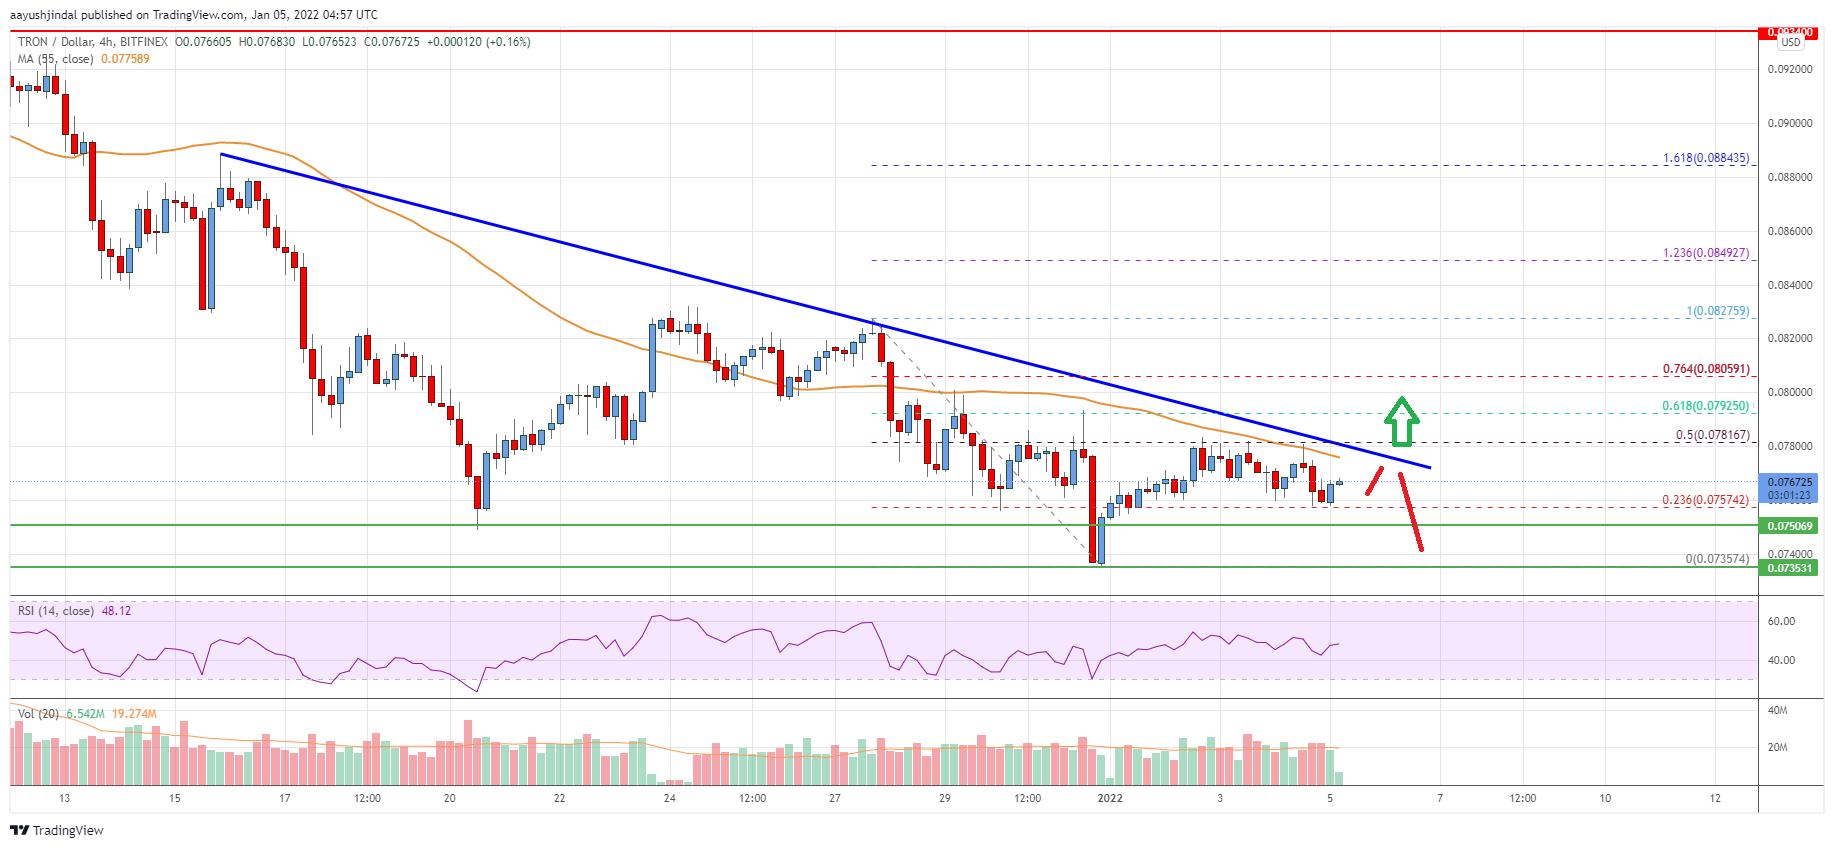
The chart indicates that TRX price is now trading below $0.0800 and near the 55 simple moving average (4-hours). Overall, the price could start a major increase if there is a clear break above the $0.0780 resistance.
Technical Indicators
4 hours MACD – The MACD for TRX/USD is slowly gaining momentum in the bullish zone.
4 hours RSI – The RSI for TRX/USD is near the 50 level.
Key Support Levels – $0.0750 and $0.0735.
Key Resistance Levels – $0.0780, $0.0820 and $0.0850.


Leave a Reply
You must be logged in to post a comment.