
- Tron price is trading in a bearish zone below the $0.0285 and $0.0300 resistance levels against the US Dollar.
- TRX price is now trading well below the $0.0265 pivot and the 55 simple moving average (4-hours).
- There is a key bearish trend line forming with resistance near $0.0278 on the 4-hours chart (data feed via Bitfinex).
- The pair is likely to continue lower and it could dive if it clears the $0.0240 support zone.
TRON price is currently trading in a bearish zone below $0.0265 against the US Dollar, similar to bitcoin. TRX price must stay above $0.0240 to avoid a sharp decline.
Tron Price Analysis
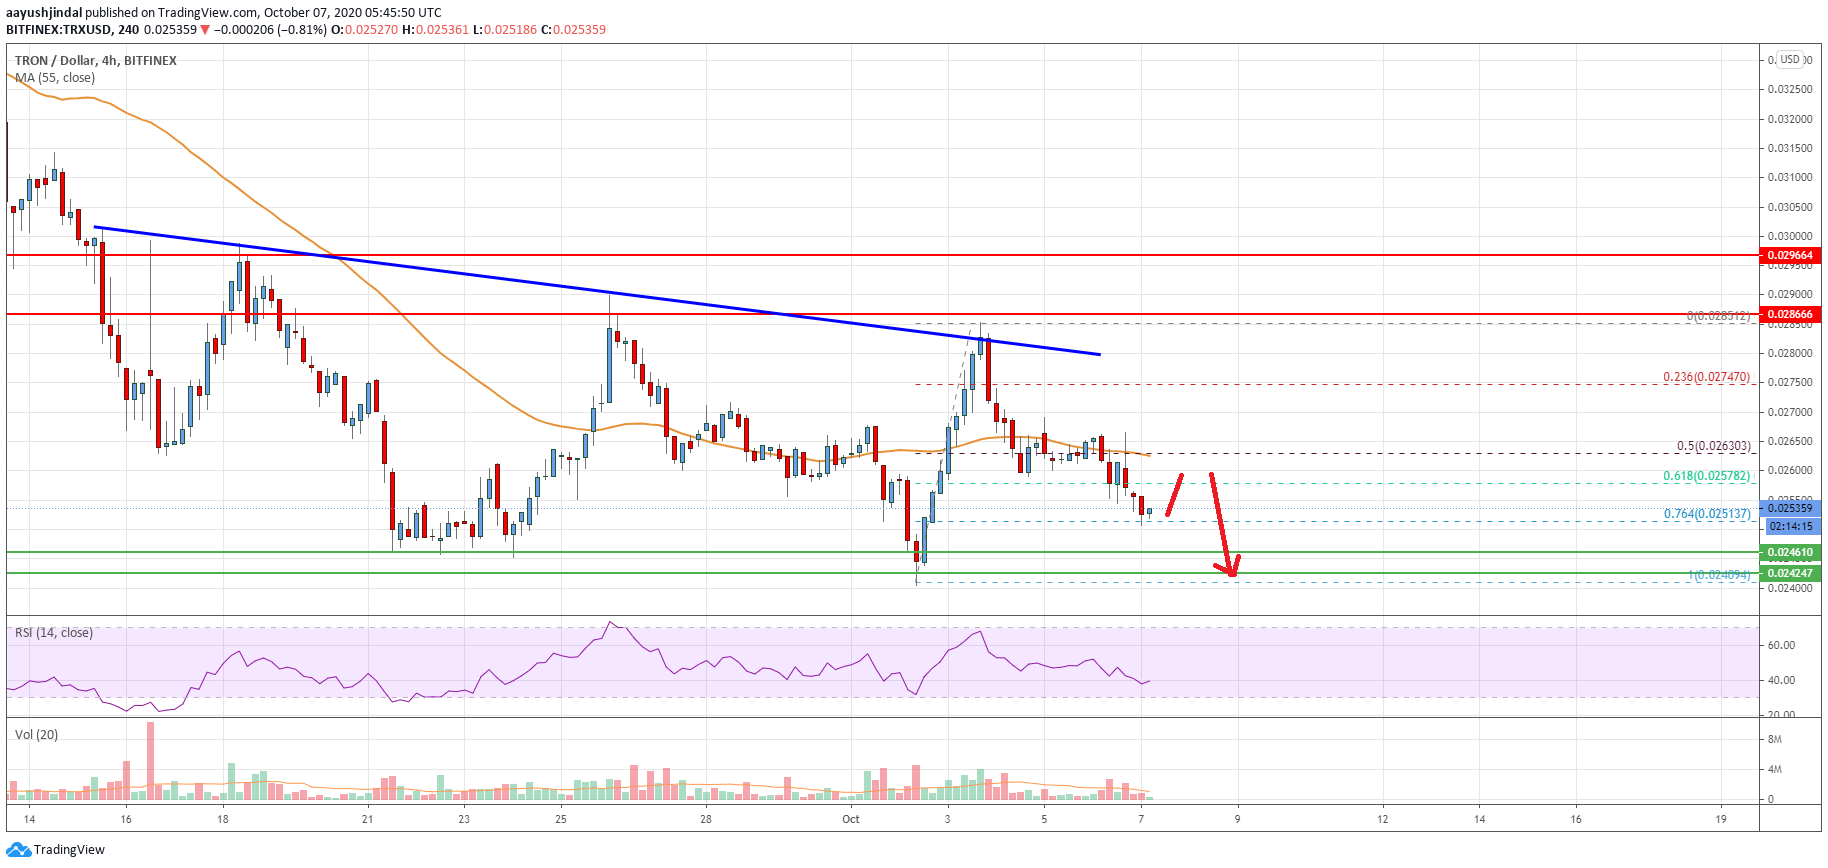
TRON price made another attempt to clear the $0.0280 resistance level against the US Dollar. However, TRX price struggled to gain bullish momentum above $0.0280 and started a fresh decline from the $0.0285 high.
The price broke the $0.0272 support level and the 55 simple moving average (4-hours) to move into a bearish zone. There was also a break below the 50% Fib retracement level of the upward move from the $0.0240 swing low to $0.0285 high.
It is now trading well below the $0.0265 pivot and the 55 simple moving average (4-hours). An initial support is near the $0.0251 level since it is close to the 76.4% Fib retracement level of the upward move from the $0.0240 swing low to $0.0285 high.
Any further losses may perhaps put a lot of pressure on the bulls and the price could retest the $0.0240 support. A successful daily close below $0.0240 might start another sharp decline and the price could dive towards the $0.0200 support.
If there is an upside correction, the price might face hurdles near the $0.0265 level and the 55 SMA. There is also a key bearish trend line forming with resistance near $0.0278 on the 4-hours chart.
A clear break above the trend line resistance and then a follow up move above the $0.0280 resistance is needed for a sustained move higher in the near term.
The chart indicates that TRX price is clearly trading in a bearish zone below the $0.065 resistance. Overall, the price is likely to continue lower and it could dive if it clears the $0.0240 support zone.
Technical Indicators
4 hours MACD – The MACD for TRX/USD is showing negative signs in the bearish zone.
4 hours RSI – The RSI for TRX/USD is currently near the 40 level, with bearish signs.
Key Support Levels – $0.0250 and $0.0240.
Key Resistance Levels – $0.0265, $0.0280 and $0.0285.


Leave a Reply
You must be logged in to post a comment.