- Ripple price traded as low as $0.2839 and recently started an upside correction against the US dollar.
- The price recovered above the $0.3100 and $0.3200 resistance levels to start the correction.
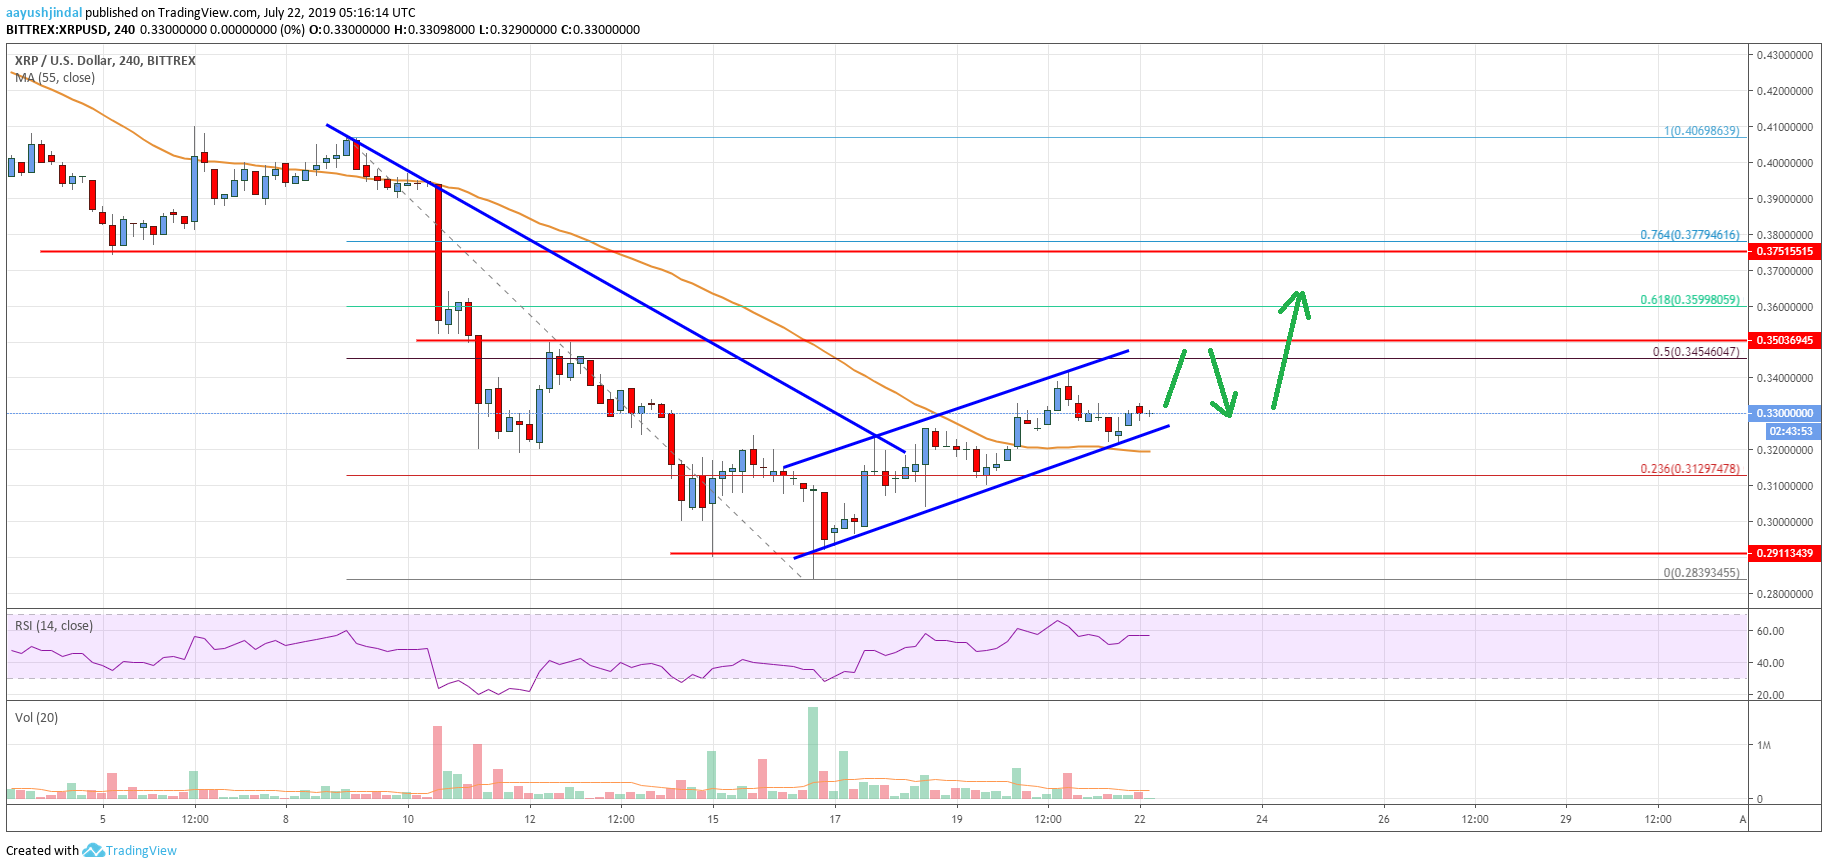
- There is a rising channel forming with support near $0.3260 on the 4-hours chart of the XRP/USD pair (data source from Bittrex).
- The price could continue to rise and it might even attempt to surpass the key $0.3500 resistance.
Ripple price is slowly recovering with positive signs against the US Dollar. XRP price might soon test the key $0.3500 resistance level, where the bears may take a stand.
Ripple Price Analysis
This past week, there a downside extension in bitcoin, Ethereum, bitcoin cash, ADA and ripple against the US Dollar. The XRP/USD pair broke the $0.3000 support level and settled well below the 55 simple moving average (4-hours). Moreover, the pair even broke the $0.2950 support level and traded to a new monthly low. A swing low was formed at $0.2839 and the price recently started an upside correction.
It broke the $0.3000 and $0.3100 resistance levels. Moreover, there was a break above the $0.3200 resistance plus the 23.6% Fib retracement level of the last slide from the $0.4069 high to $0.2839 low. Additionally, there was a close above the $0.3200 level and the 55 simple moving average (4-hours). However, the upward move was capped by the $0.3400 resistance level.
Ripple price dipped a few points and tested the $0.3200 support area. More importantly, there is a rising channel forming with support near $0.3260 on the 4-hours chart of the XRP/USD pair. If there is a downside break below the channel support, the pair could accelerate losses below the $0.3200 and $0.3150 support levels. The next key support is near the $0.3000 level.
On the upside, there are a few important resistances near the $0.3455 and $0.3500 levels. Besides, the 50% Fib retracement level of the last slide from the $0.4069 high to $0.2839 low is also near the $0.3450 level to act as a strong resistance. Therefore, a successful close above the $0.3500 resistance might spark sharp gains in the near term.

Looking at the chart, ripple price seems to be correcting higher and is approaching a few key hurdles near $0.3500. Therefore, the price could either break $0.3500 and continue higher or start a fresh decline. In the bearish scenario, the price may even break the $0.3200 support.
Technical indicators
4 hours MACD – The MACD for XRP/USD is currently placed in the bullish zone.
4 hours RSI (Relative Strength Index) – The RSI for XRP/USD is now well above the 50 level, with a flat structure.
Key Support Levels – $0.3260, $0.3200 and $0.3050.
Key Resistance Levels – $0.3450 and $0.3500.


Leave a Reply
You must be logged in to post a comment.