- Ripple price remained well bid above the key $0.2550 support area against the US dollar.
- The price is currently trading in a range below the key $0.2750 and $0.2800 resistance levels.
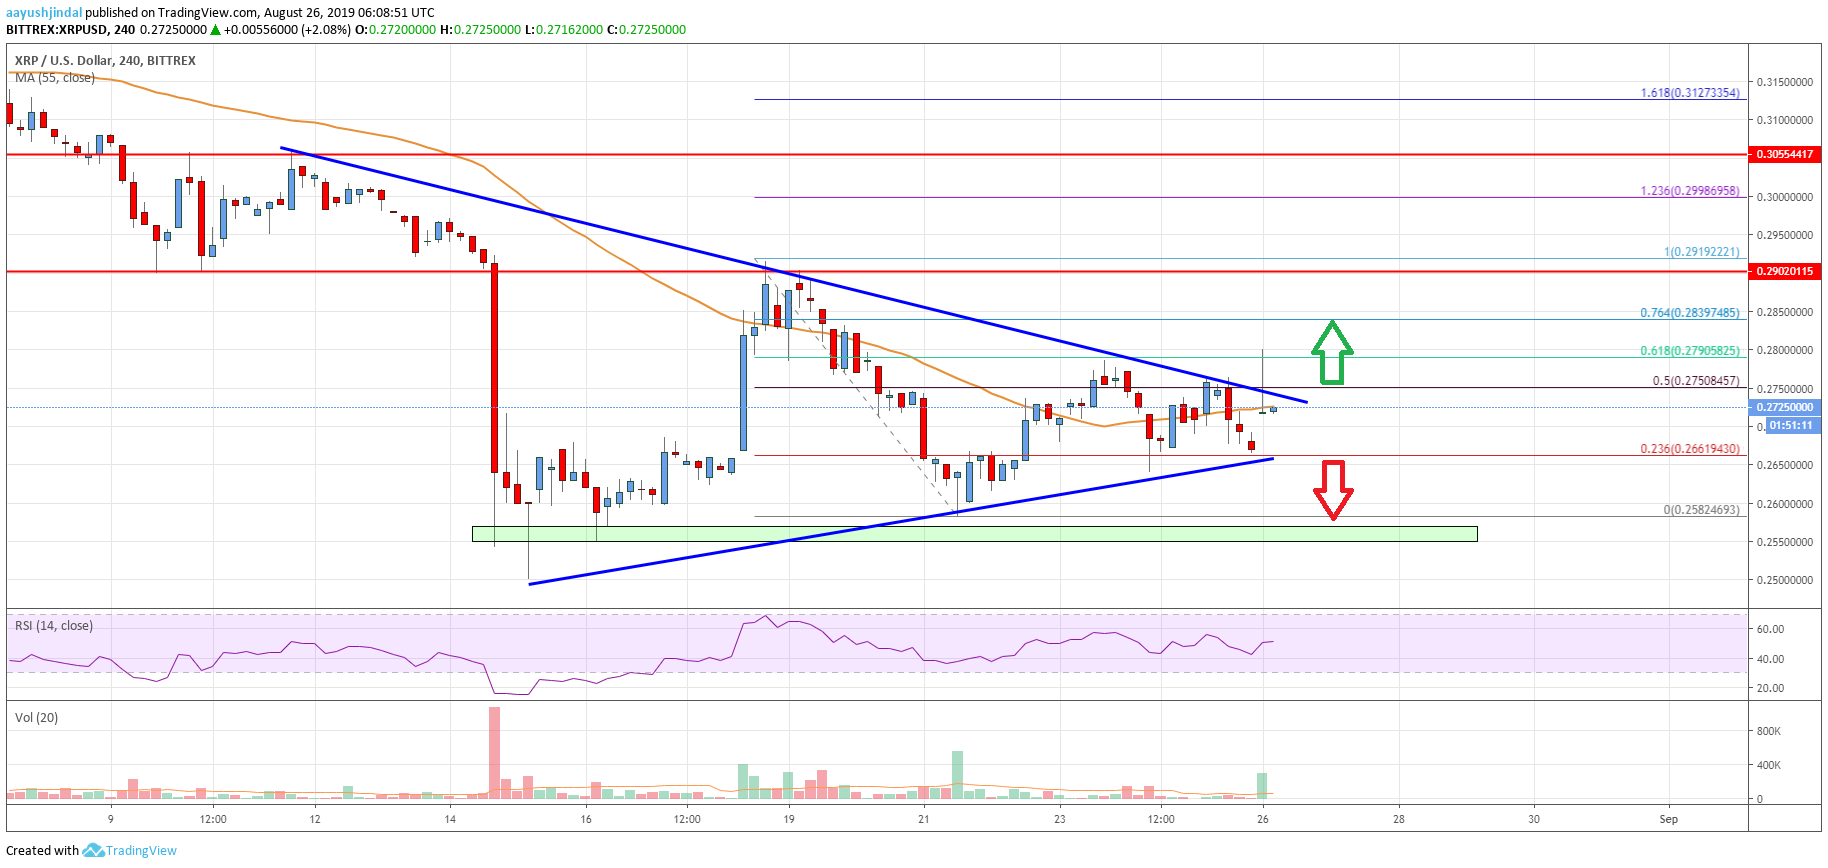
- There is a major contracting triangle forming with resistance near $0.2750 on the 4-hours chart of the XRP/USD pair (data source from Bittrex).
- The price is likely to surge above the $0.2750 resistance as long as it is above $0.2550.
Ripple price seems to be setting up for the next break against the US Dollar. XRP price could either surge above $0.2750 or decline sharply below the $0.2550 support.
Ripple Price Analysis
This past week, there was a bearish reaction in bitcoin, Ethereum, bitcoin cash, litecoin and ripple against the US Dollar. The XRP/USD pair failed to surpass the key $0.2900 and $0.2910 resistance levels. As a result, the price declined below the $0.2800 support level. Moreover, there was a close below the $0.2750 level and the 55 simple moving average (4-hours).
Finally, the price traded below $0.2600 and tested the $0.2550 support area. A swing low was formed near $0.2580 and recently the price started an upside correction. There was a break above the $0.2650 level plus the 23.6% Fib retracement level of the key decline from the $0.2919 swing high to $0.2582 low. However, the upward move was capped by the $0.2750 and $0.2760 resistance levels.
Moreover, the price struggled to stay above the 50% Fib retracement level of the key decline from the $0.2919 swing high to $0.2582 low. The price is now trading in a range below the $0.2750 resistance. More importantly, there is a major contracting triangle forming with resistance near $0.2750 on the 4-hours chart of the XRP/USD pair. If there is an upside break above the $0.2750 resistance, the price could continue to rise in the near term.
The next key resistance is near the $0.2800 and $0.2820 levels. However, the main resistance for a sustained upward move is near the $0.2900 level. Conversely, if there is a downside break below the $0.2650 level, the price might retest the $0.2550 support. Any further losses could trigger a strong bearish wave towards the $0.2400 or $0.2320 support.

Looking at the chart, ripple price is clearly preparing for the next break and it is likely to surge above the $0.2750 resistance as long as it is above the $0.2550 support area.
Technical indicators
4 hours MACD – The MACD for XRP/USD is struggling to gain momentum in the bullish zone.
4 hours RSI (Relative Strength Index) – The RSI for XRP/USD is currently just above the 50 level.
Key Support Levels – $0.2650, $0.2550 and $0.2500.
Key Resistance Levels – $0.2750 and $0.2900.


Leave a Reply
You must be logged in to post a comment.