- Stellar lumen price is struggling below the $0.100 resistance zone against the US Dollar.
- XLM price is now trading below $0.0980 and the 55 simple moving average (4 hours).
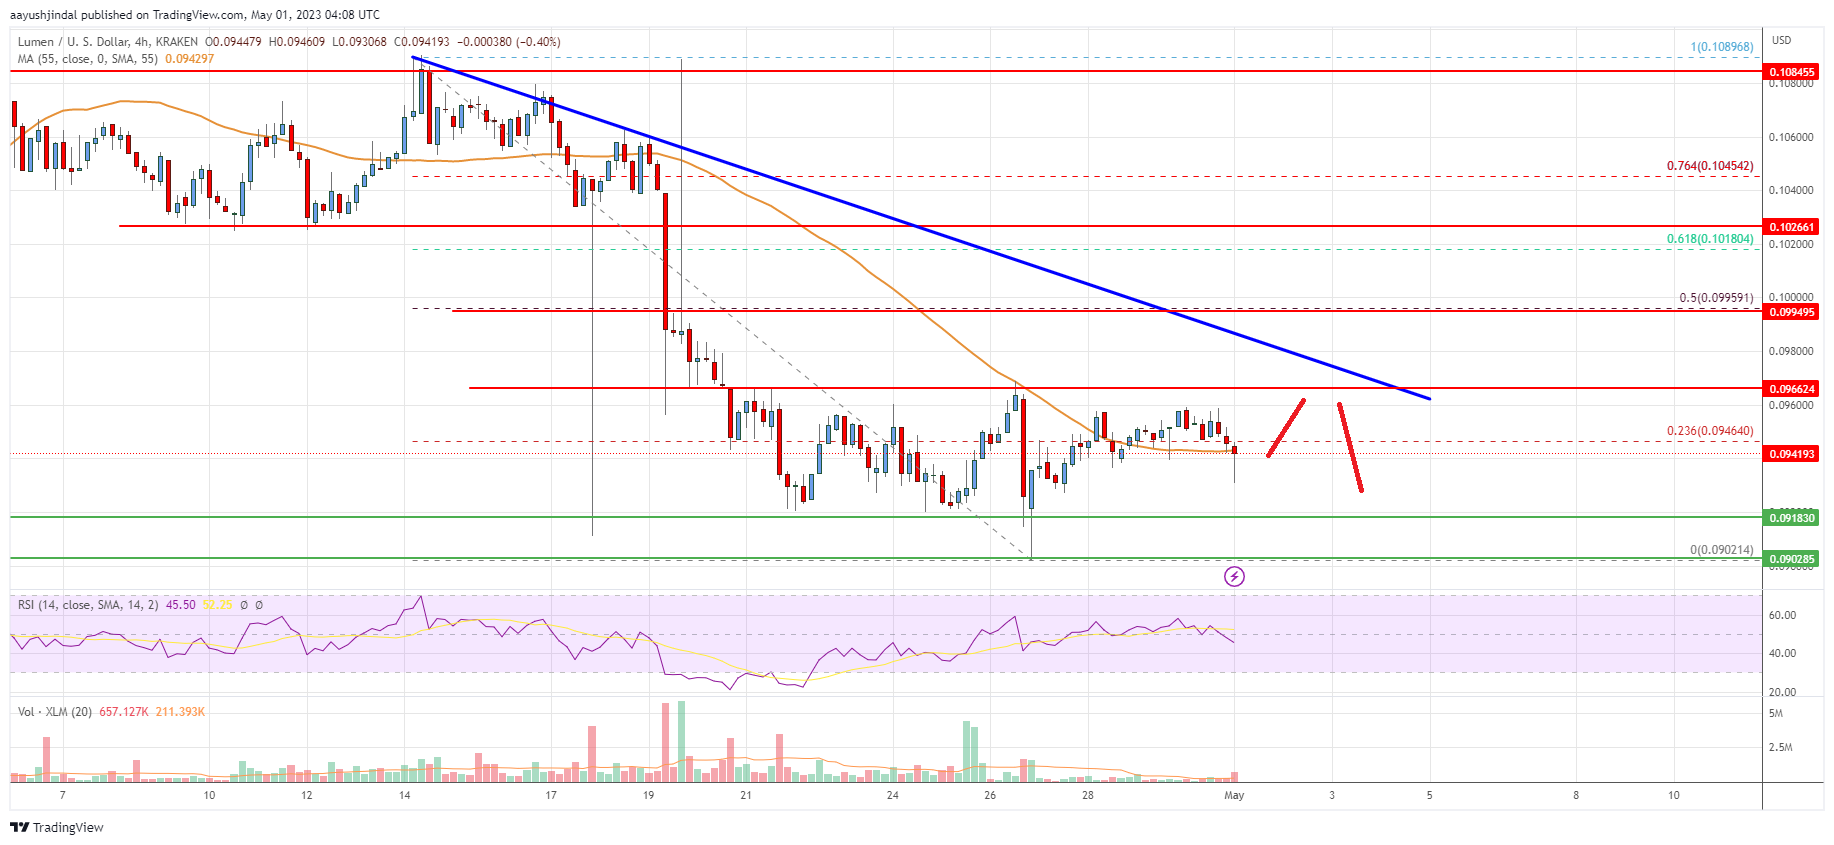
- There is a major bearish trend line forming with resistance near $0.0980 on the 4-hour chart (data feed via Kraken).
- The pair could start a recovery wave if it clears the $0.100 resistance.
Stellar lumen price is trading below $0.100 against the US Dollar, similar to Bitcoin. XLM price could extend losses if it stays below $0.100 for a long time.
Stellar Lumen Price Analysis (XLM to USD)
After a major decline below $0.100, Stellar Lumen price attempted a recovery wave against the US Dollar. The XLM/USD pair climbed above $0.0950 but it failed to extend gains.
It resumed its decline and traded below the $0.0918 support. A low is formed near $0.0902 and the price is now attempting a fresh recovery wave. It was able to clear the 23.6% Fib retracement level of the downward move from the $0.1090 swing high to the $0.0902 low.
XLM is still trading below $0.0980 and the 55 simple moving average (4 hours). There is also a major bearish trend line forming with resistance near $0.0980 on the 4-hour chart.
On the upside, the price is facing resistance near the $0.0965 level. The next major resistance is near the $0.0980 zone and the trend line. The first major resistance is near the $0.100 level or the 61.8% Fib retracement level of the downward move from the $0.1090 swing high to the $0.0902 low.
A clear upside break above the $0.100 zone might send the price toward $0.1080. Any more gains could lead the price toward the $0.1120 level or even $0.1200.
Initial support on the downside is near the $0.0918 level. The main support is near the $0.090 zone. Any more losses could lead the price toward the $0.0865 level in the near term, below which the price might even retest $0.0850.

The chart indicates that XLM price is now trading below $0.0980 and the 55 simple moving average (4 hours). Overall, the price could start a major decline if there is a clear move below the $0.090 support.
Technical Indicators
4 hours MACD – The MACD for XLM/USD is gaining momentum in the bearish zone.
4 hours RSI – The RSI for XLM/USD is now below the 50 level.
Key Support Levels – $0.0920 and $0.090.
Key Resistance Levels – $0.0965, $0.0980, and $0.100.


Leave a Reply
You must be logged in to post a comment.