
- Tron price started a strong decline after it failed to clear the $0.0320 resistance against the US Dollar.
- TRX price is now trading below the $0.0300 level and the 55 simple moving average (4-hours).
- There was a break below a key contracting triangle with support near $0.0300 on the 4-hours chart (data feed via Bitfinex).
- The pair could accelerate lower if there is a clear break below $0.0275 and $0.0270.
TRON price is gaining bearish momentum below $0.0300 against the US Dollar, similar to bitcoin. TRX price must stay above $0.0275 to avoid more losses in the near term.
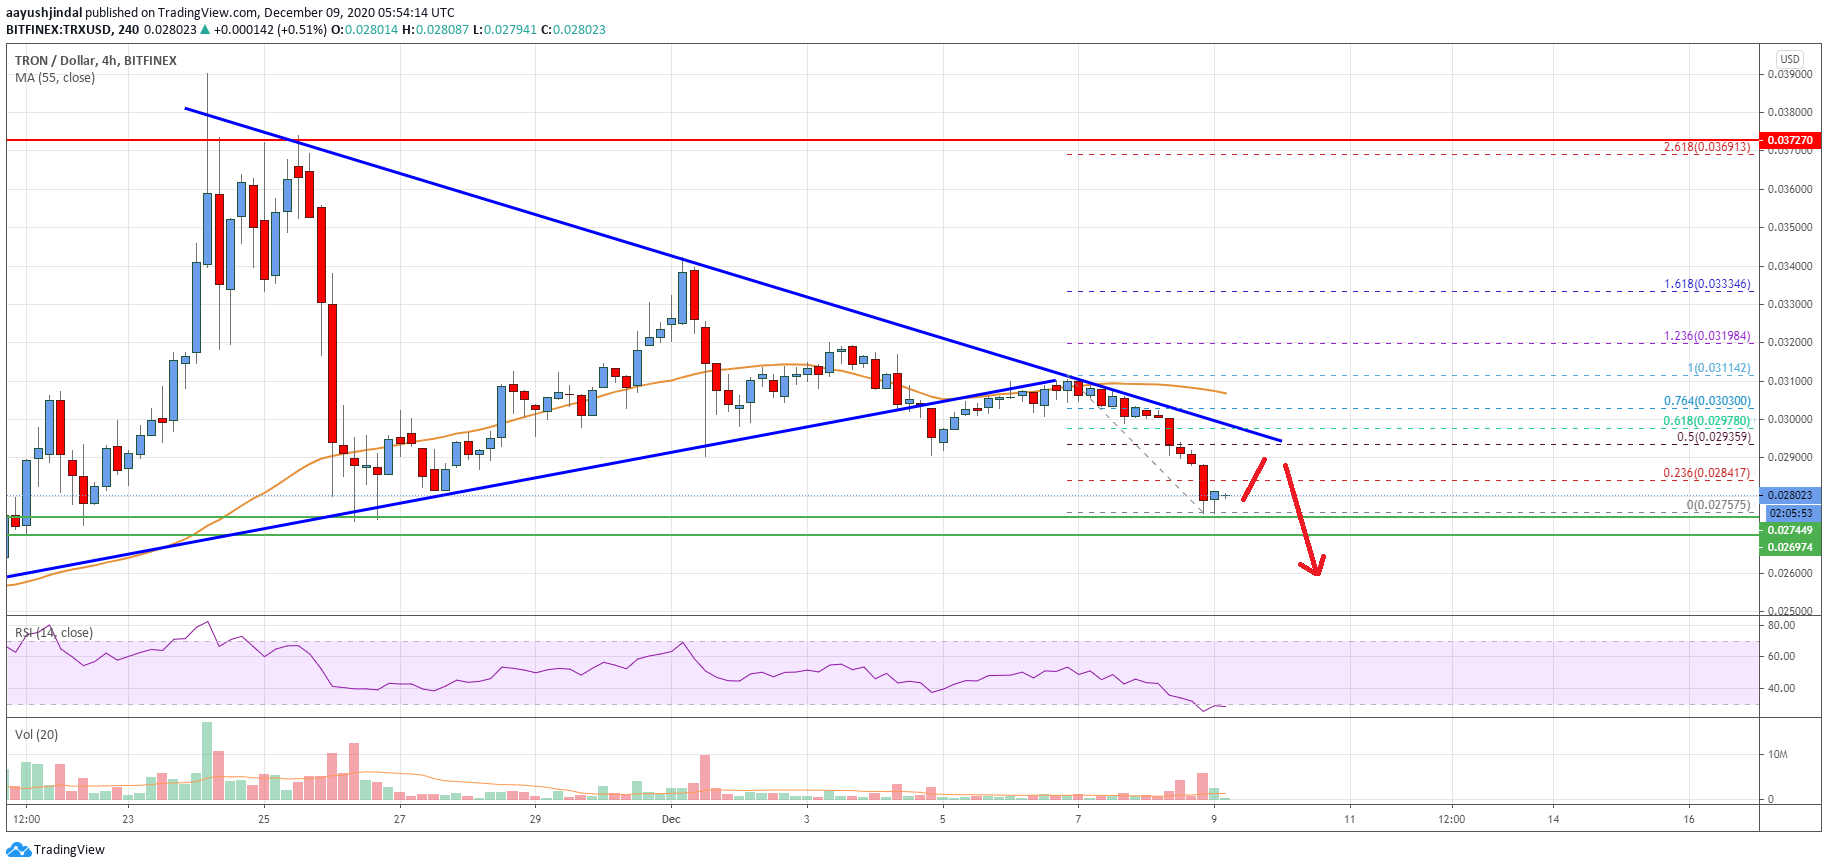
Tron Price Analysis
TRON price started a steady decline from well above $0.0320 and $0.0310 against the US Dollar. TRX price formed a swing high near $0.0311 before declining below the $0.0300 support level.
The price even settled below the $0.0300 level and the 55 simple moving average (4-hours). During the recent decline, there was a break below a key contracting triangle with support near $0.0300 on the 4-hours chart. The same broken triangle support trend line acted as a resistance and triggered more losses below $0.0290.
The price even spiked below the $0.0280 support and tested the $0.0275 support. A low is formed near $0.0275 and tron price is currently consolidating losses.
An initial resistance is near the $0.0285 level. It is close to the 23.6% Fib retracement level of the recent decline from the $0.0311 high to $0.0275 low. The first major resistance is near the $0.0292 level or the triangle upper trend line.
The 50% Fib retracement level of the recent decline from the $0.0311 high to $0.0275 low is also near the $0.0293 level. To move into a positive zone, the price must clear the $0.0292 and $0.0300 resistance levels in the near term.
Conversely, the price might continue to move down below the $0.0275 support. If there is a downside break below the $0.0275 support, there is a risk of more losses towards the $0.0250 support level. Any more losses could spark a sharp decline towards $0.0220.
The chart indicates that TRX price clearly trading near a major support at $0.0275. Overall, the price could accelerate lower if there is a clear break below $0.0275 and $0.0270.
Technical Indicators
4 hours MACD – The MACD for TRX/USD is showing negative signs in the bearish zone.
4 hours RSI – The RSI for TRX/USD is well below the 40 level.
Key Support Levels – $0.0275 and $0.0270.
Key Resistance Levels – $0.0285, $0.0292 and $0.0300.


Leave a Reply
You must be logged in to post a comment.