
- Tron price started a decent increase above the $0.0600 level against the US Dollar.
- TRX price is now trading above $0.0620 and the 55 simple moving average (4-hours).
- There was a break above a key bearish trend line with resistance near $0.0608 on the 4-hours chart (data feed via Bitfinex).
- The pair could continue to move up if it clears the $0.0650 resistance zone.
TRON price started a fresh increase above $0.0600 against the US Dollar, similar to bitcoin. TRX price could rally further if it climbs above $0.0650.
Tron Price Analysis
After a downside spike, tron price found support near the $0.055 level against the US Dollar. TRX price formed a base above the $0.0550 level and started a fresh increase.
It traded above the $0.0580 and $0.0600 resistance levels to move into a positive zone. The price gained pace above the 50% Fib retracement level of the key decline from the $0.0670 swing high to $0.0554 low. Besides, there was a break above a key bearish trend line with resistance near $0.0608 on the 4-hours chart.
The price is now facing resistance near the $0.0632 level. It is near the 61.8% Fib retracement level of the key decline from the $0.0670 swing high to $0.0554 low.
The next major resistance is near the $0.0645 level. A close above $0.0645 is must for a fresh increase. In the stated case, the price could rise towards the $0.0670 resistance in the near term. Any more gains could set the pace for a larger increase towards the $0.0750 level.
On the downside, an initial support is near the $0.0610 level and the broken trend line. The next major support is now forming near $0.0600. If there is a downside break below the $0.0600 support, the price might revisit the $0.0580 support. Any more losses might call for a move towards the $0.0550 zone in the near term.
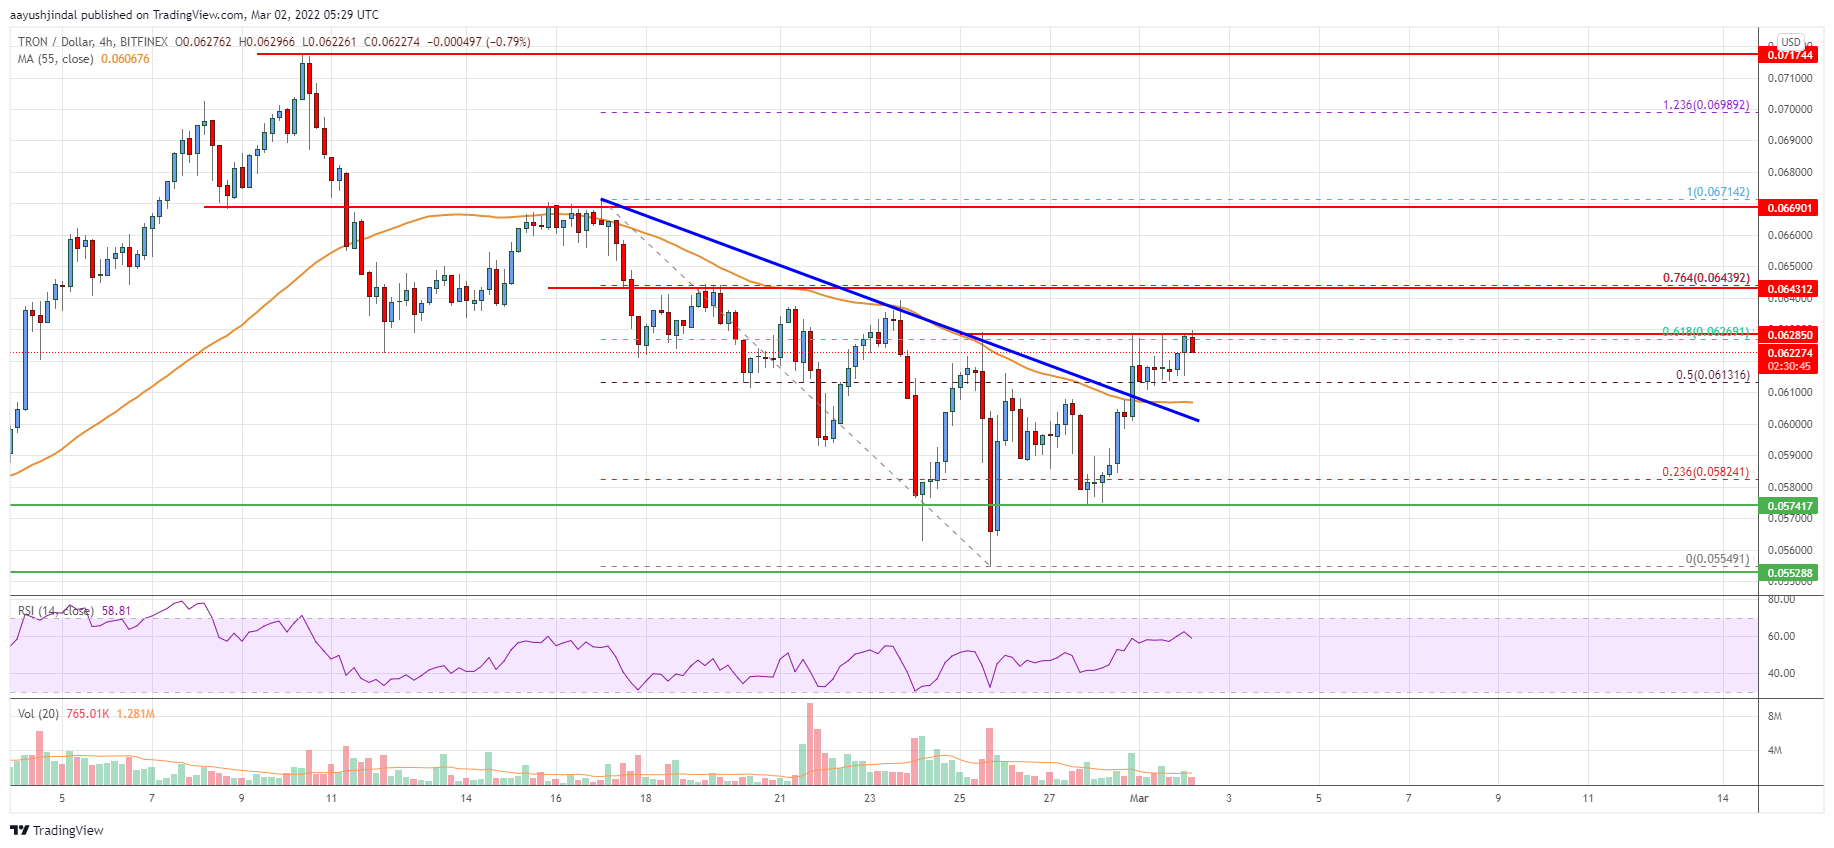
The chart indicates that TRX price is now trading above $0.0600 and near the 55 simple moving average (4-hours). Overall, the price could continue to move up if it clears the $0.0650 resistance zone.
Technical Indicators
4 hours MACD – The MACD for TRX/USD is slowly gaining momentum in the bullish zone.
4 hours RSI – The RSI for TRX/USD is above the 50 level.
Key Support Levels – $0.0600 and $0.0580.
Key Resistance Levels – $0.0632, $0.0645 and $0.0720.


Leave a Reply
You must be logged in to post a comment.