- Dash price surged higher and broke the $100.00 and $110.00 resistance levels against the US Dollar.
- The price gained more than 12% and traded towards the $120.00 resistance level.
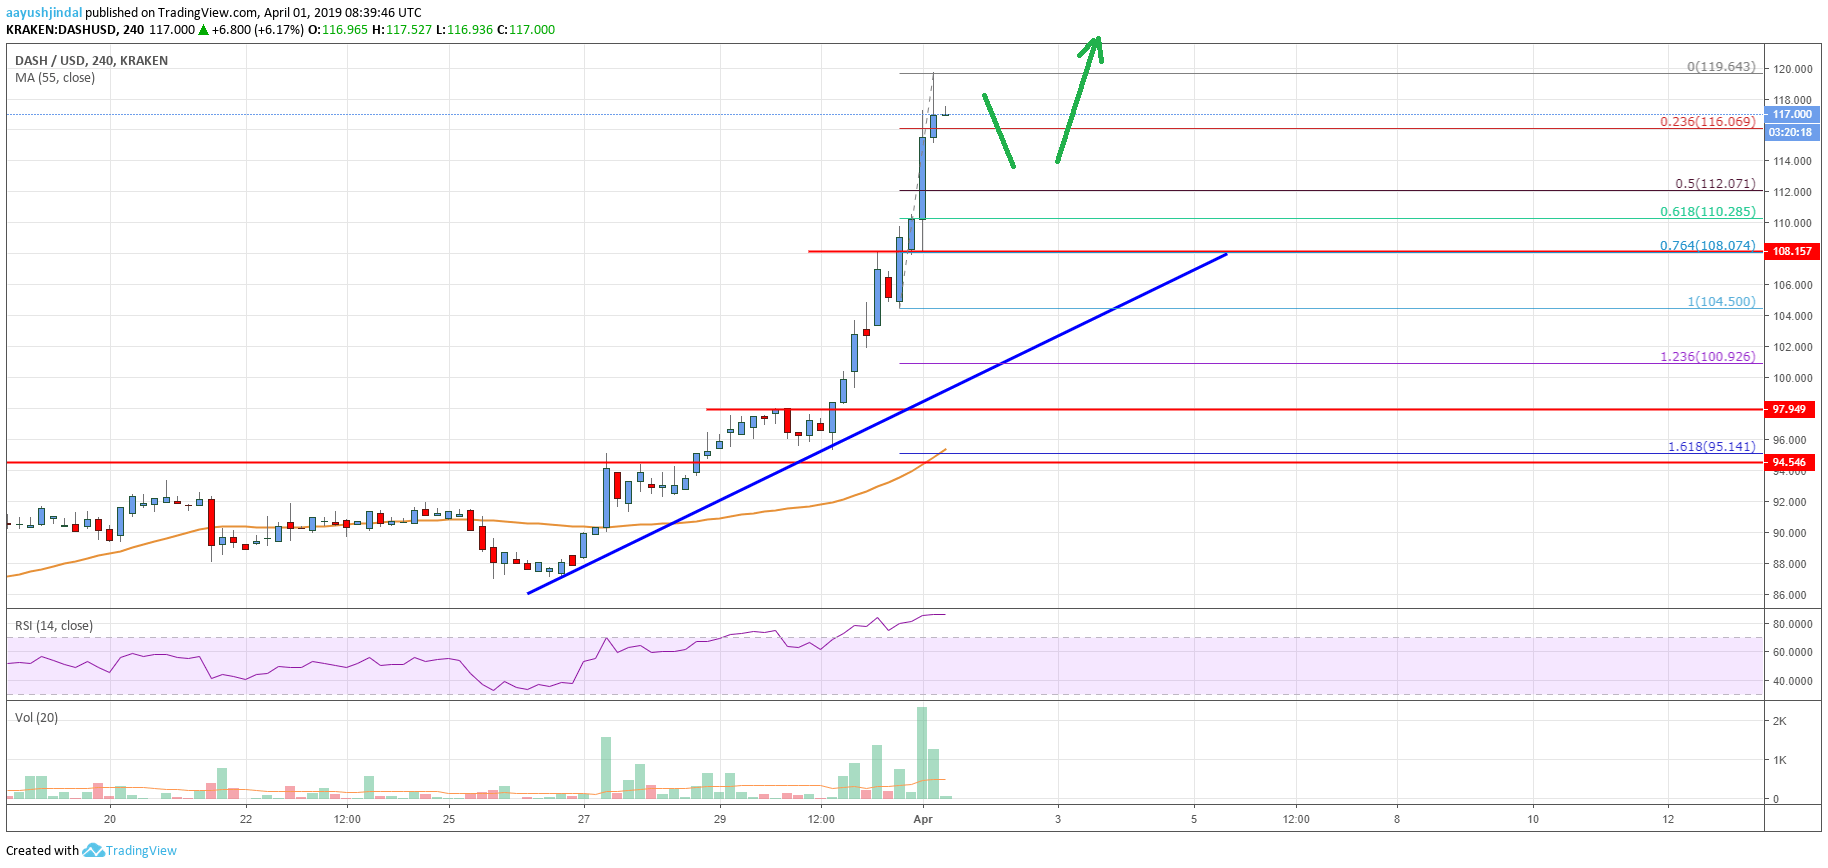
- There is a key connecting bullish trend line formed with support at $104.00 on the 4-hours chart of the DASH/USD pair (data feed from Kraken).
- The pair remains in a strong uptrend and it could continue higher towards the $125.00 and $130.00 levels.
DASH price rallied recently with heavy bullish moves against the US Dollar and bitcoin. Buyers remain in full control and it seems like they are eyeing a test of the $125.00 level.
DASH Price Analysis
After swing moves, there were decent upsides in DASH, ripple, Ethereum, bitcoin cash, litecoin and other major cryptocurrencies against the US Dollar. As discussed in the previous analysis, dash price did stay above the $84.00 support and later jumped above the $100.00 resistance. More importantly, there was a successful close above the $100.00 level and the 55 simple moving average (4-hours). Recently, the price gained bullish momentum and surged more than 12% above the $110.00 resistance.
The price even broke the $115.00 level and traded close to the $120.00 level. A swing high was formed at $119.64 and the price is currently consolidating gains. An initial support is near the 23.6% Fib retracement level of the last wave from the $104.50 low to $119.64 high. If there is an extended downside correction, the price may test the $112.00 support area. It coincides with the 50% Fib retracement level of the last wave from the $104.50 low to $119.64 high.
Additionally, there is a key connecting bullish trend line formed with support at $104.00 on the 4-hours chart of the DASH/USD pair. Therefore, if the price corrects lower, it could find a strong support near the $110.00 level. On the upside, an initial resistance is near the $120.00 level. If buyers remain in action, there are chances of a push above the $125.00 barrier. The next key resistance is around $134.00, above which the price may test $140.00.

Looking at the chart, DASH price clearly flew above the $110.00 resistance level. However, it won’t be easy for buyers to gain strength above the $120.00 level. Therefore, there might be a downside correction towards the $112.00 or $110.00 level before a fresh increase in the coming sessions.
Technical indicators
4 hours MACD – The MACD for DASH/USD is currently placed heavily in the bullish zone, with a positive bias.
4 hours RSI (Relative Strength Index) – The RSI for DASH/USD is currently near the extreme overbought levels.
Key Support Levels – $116.00 and $112.00.
Key Resistance Levels – $120.00 and $125.00.


Leave a Reply
You must be logged in to post a comment.